Health
Why was the human genome never completed?
Why was the human genome never completed? So far, no human genome has been read completely. Scientists expect to pass this milestone for the first time this year.
Why was the human genome never completed?
Before the end of 2023, you should be able to read the complete human genome, which will be the story of a person; It will also provide insight into who he is and where he came from, and his future. The complete human genome is probably not very fun at first glance and it will be very, very long. But the online publication of the complete human genome without any flaws will be a very important moment.
At this point you may feel like you’ve heard this before: the human genome was published years ago. Was it not done perfectly?
In fact, the human genome had never been completely read. The first draft of the human genome was published in 2001, and then in 2003, a group of scientists from the Human Genome Project announced that they had completed the work. This sequence, which was prepared by combining DNA fragments from different people, became the reference sequence with which the DNA of other humans can be compared.
Compiling the human genome by combining the genomic information of several individuals was the best that scientists could do at the time, but it had significant flaws and errors. Later versions of the human genome improved, but many problems remained. Only in the last few years has technology advanced enough to read the entire human genome without gaps and with minimal errors.
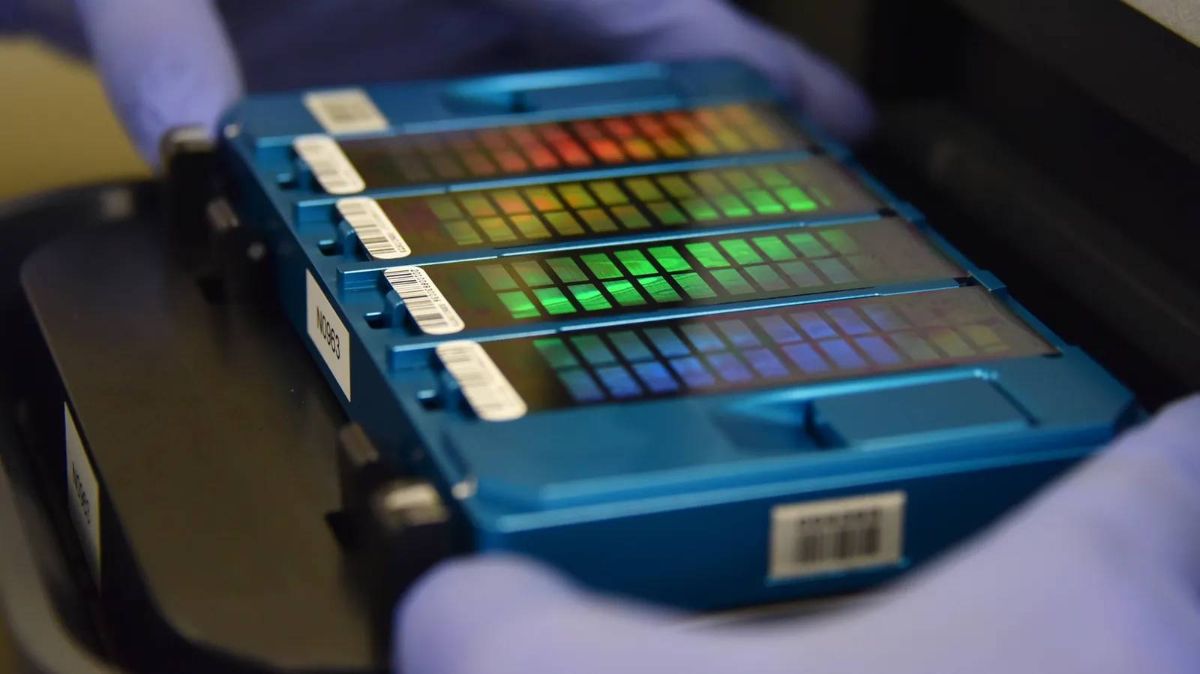
But all human genome sequences published so far have been hybrid, using DNA from multiple individuals. This year, the entire genome of a person (a man named Leon Pushkin) is going to be published for the first time. This complete and single human genome will be a monumental technical achievement. It’s only been 70 years since Rosalind Franklin’s black-and-white image revealed the double helix structure of DNA and revolutionized scientists’ understanding of how genetic information is stored. Today, we have the ability to read the entire genetic book that gives rise to the unique characteristics of a human being.
But the project’s geneticists say this is just the beginning. They want to sequence the genomes of people from around the world to create a true picture of the genetic diversity of the human species. They want to find out what the previously unsequenced parts of the DNA do. They also want to introduce whole-genome sequencing into clinics to help doctors diagnose and treat diseases.
In short, the human genome will never be complete, and we will never finish reading it.
The first human genome
The Human Genome Major Project (HGP) was one of the largest scientific projects at a cost of about $3 billion. The goal of this project, which began in 1990, was to read the entire DNA that the average human carries in his cells. The first draft of the sequence was published a little over a decade later. In 2001, at the same time, another version of the human genome was published by Celera Genomics.
The human genome came with many promises. With the help of the human genome, we understand what genes do, especially genes that play a role in diseases. This enables personalized medicine where we receive treatments tailored to our genetic makeup.
The complete human genome also provides insights into our evolutionary origins: how exactly are we different from our closest living relatives, chimpanzees, and bonobos?
Some of these promises have happened and some have not yet been fulfilled. Our knowledge of the function of many genes and their roles in diseases ranging from breast cancer to schizophrenia has increased. However, most diseases are affected by hundreds of genes, so we are still a long way from genomic medicine.
Read More: Scientists have found a way to diagnose colon cancer more easily
A small number of inherited diseases are caused by a faulty gene, and the use of genetic screening to identify people at risk for rare diseases is largely limited to those at high risk.
Genetics has also changed our understanding of human evolution. For example, it has been shown that our ancestors interbred with other hominids such as Neanderthals.
Meanwhile, in the background of scientists’ efforts to provide a complete human genome, lies the unpleasant fact that the human genome has never been truly complete. While geneticists have been revising it since the first draft was published (last revised in February 2022), parts of the genome are still missing.
Repeated sequences
One of the problems is that parts of DNA are highly repetitive. In certain parts of the genome, the same sequences are repeated over and over, sometimes thousands of times.
Duplicated DNA often appears in similar parts of the genome. Our DNA is not stored as a long, continuous rope, but is divided into smaller pieces called chromosomes.
Chromosomes are X-shaped (except for the Y-shaped chromosome carried by males), and there are 23 pairs of them in human cells. Each of the chromosomes has duplicated DNA at the end of its four arms (telomeres) and at the central junction (centromeres), and both of these are important.
Telomeres act as protective caps and their damage is associated with aging. Meanwhile, centromeres are important for the process of cell division that underlies growth and reproduction. DNA rearrangements at centromeres play a role in the development of some cancers.
The Human Genome Project failed to sequence the duplicated DNA and did not attempt to do so. Their method could not solve this challenge. They didn’t read the entire genome at once, but instead divided it into small pieces a few hundred bases long, read them, and then put the sequences together using a computer. This method is not efficient for repeated segments, because the computer does not know in what order those segments are put together. “Eight percent of the copy that was officially completed in 2003 was missing,” says Adam Filippi, head of the genome informatics division at the National Human Genome Research Institute in Maryland.
Therefore, our duplicated DNA remained almost completely unread for 20 years. Then in 2021, Filippi and his colleagues announced that they had all read it.
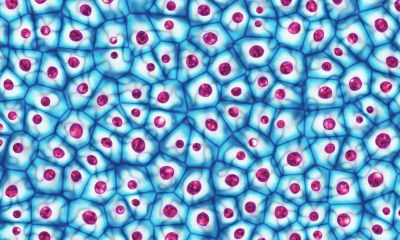
What is the genome?
The genome is often compared to a book written in the DNA alphabet instead of the English alphabet. The DNA alphabet consists of only four letters: A, C, G, and T. Each of these letters represents different molecules called “bases” that are strung along the length of the DNA molecule. Any particular sequence of these letters constitutes a gene. The responsibility of translating this information lies with the molecular machines inside our cells. Some genes provide the information needed to make different proteins that have different functions in the body, while other parts of DNA have regulatory functions. What the Human Genome Project team achieved was the exact order of bases along the length of DNA; Something like CGATTTCCGAAAA and so on for over three billion characters.
Reading the human genome from beginning to end
The Telomere to Telomere (T2T) Consortium was not a big, famous, multi-billion dollar project. “It was really a public effort that took place during birth,” says Karen Miga, a geneticist at the University of California, Santa Cruz. In the eyes of many genomic experts, we appeared out of nowhere.
” A key advance was the ability to accurately read long stretches of DNA, says Evan Eichler, a professor of genome sciences at the University of Washington in Seattle. Previously, technologies capable of reading long sequences had been developed, but until recently they were not accurate enough. Therefore, improving the accuracy of these technologies was a key development. Also, the ability to read sequences that spanned over 100,000 bases was an important advance.
T2T’s first major breakthrough came in July 2020 when the project’s researchers published the complete sequence of the X chromosome. At the time, the best available sequence of the X chromosome had 29 gaps, and the T2T team filled in all the gaps. The following year, they published the complete sequence of chromosome 8. In 2021, they also published a preprint titled “The Complete Sequence of a Human Genome,” in which they filled in 8 percent of the missing sequence.
Reading repetitions
But the human genome had not been read completely yet. Ishler says the team used a little trick that some called cheating.
Most cells in our body have two copies of each chromosome: one from the mother and one from the father. This makes it more difficult to put the sequences together on the computer because the two versions differ very little. To solve this problem, T2T used abnormal cells that have two copies of the father’s DNA that are nearly identical. The mentioned cells were the result of a hydatiform mole (molar or baby-eating pregnancy), which is a type of failed pregnancy.
Eggs and sperm have only one copy of each chromosome, so when a sperm fertilizes an egg, the resulting embryo has two copies. However, sometimes the egg loses its DNA and is then fertilized. Then the egg cell, which has lost its DNA, replicates the sperm’s DNA. Hydatidiform moles form dangerous lesions that look somewhat like cancer and must be removed. This is what T2T sequenced. According to some researchers, they had read only half of the genome, because the complete genome has two copies of any particular sequence. Although overall, their sequence was a clear improvement over previous sequences and added more than 200 million letters and two thousand genes to the human genome.
Having a complete genome means finally being able to understand what the repetitive segments of DNA do, Miga says. “Now that we have these maps, I’m very excited to see what sequences are in these regions,” he says. But what is their main function? And if there is a problem in these areas, how can it contribute to our understanding of human disease and human health?”
Repetitive DNA contains many sequences that can move around the genome and are called “mobile DNA”. “Many of these elements have played a role in our recent evolution,” says Rachel O’Neill, a molecular geneticist at the University of Connecticut in Storrs. “Many evolutionary mutations, including placentation, loss of the tail, and some brain functions, can be attributed to this type of driver DNA.”
Meanwhile, Eishler refers to duplications, where long stretches of DNA that can contain multiple genes are duplicated at once. These sequences can evolve at an extraordinary rate. Ishler says: “The result of this phenomenon is the emergence of new genes that are specific to humans. “These genes contribute disproportionately to the differences that make us human.”
While the human and chimpanzee genomes are 99% identical, duplications are one of the ways in which important differences can arise between us and chimpanzees. The originally published human genome was largely devoid of these duplicated sequences.
Neuroscientists have shown that some duplicated genes are important in brain function. But geneticists couldn’t study them precisely because they were in repeats that didn’t occur in older genomes.
The T2T sequence was finally published in a special issue of the journal Science in March 2022. But at that time the team was moving forward.
The remaining large gap was the Y chromosome, which is only present in males. Sperm usually carry only one sex chromosome (either an X chromosome or a Y chromosome). Because the hydatidiform mole DNA used by T2T came from sperm that contained an X chromosome, the Y chromosome was not sequenced. The team needed a male donor to finish their work, so they used Pushkin.
DNA donor
Pushkin is a systems biologist at Harvard Medical School in Boston, Massachusetts. Much of his research focuses on understanding the mechanisms of aging and how to slow them down. He believes that the human life span has no limit and can be increased. Genomics is a big part of his work. Pushkin has donated his DNA to a number of major sequencing projects.
Pushkin’s first donation was to the Personal Genome project, which was launched in 2015. The goal of the project was to attract volunteers who were willing to share their DNA publicly to enable faster and more efficient research, as well as to overcome fears about the potential misuse of genomic data.
A decade later, Pushkin’s DNA was again used by the GIAB project. The goal of the project was to sequence the genomes of cell lines that could be grown indefinitely in the laboratory and make it easier to study the effects of mutations. Pushkin’s genome was favorable because he had also enrolled his parents in the project and provided them with information on his mother, father, and son.
Pushkin does not regret his choices, although he points to an unpleasant consequence. “I can’t go to labs that work with my cells, because if my immortal cells somehow get into my body, my immune system won’t recognize them, and there’s a chance that the immune system will go into overdrive, and it’s a dangerous situation,” he says. come.” He is delighted to have his DNA sequenced again by T2T, this time in full.
In December 2022, T2T published another preprint paper describing the complete sequence of Pushkin’s Y chromosome. Since this chromosome has many repetitions and complications, more than half of the chromosome was not present in the past genomes. The new sequence added more than 30 million characters including dozens of genes.
The team is now working on Pushkin’s complete genome, including both copies of each chromosome. “We’ve finished sequencing and reconstructing it,” says Filippi. The resulting genome is complete and without defects and takes duplications into account. All that remains is the review. Filippi says there are a handful of errors we can check. He says their final genome should be published this year.
Pan Genome
Will the human genome be completed this year? The answer is no because there is no single human genome. Each person’s DNA is different and these differences are important. We won’t really understand the genome unless we have a record of how it differs between different populations.
The initial HGP project attempted to address this problem by drawing its sample from a few individuals, all from New York. The sequence that was released was a combination of all of them. Indeed, they tried to provide an average genome, but an American city cannot represent the full spectrum of human genetic diversity. This is why many members of the T2T Consortium are also enrolled in another project: the Human Pangenome Reference Consortium. The goal of this project is to sequence the genomes of hundreds of people from all over the world.
The project’s genomes will not be complete, as they will lose some degree of completeness in exchange for using automated methods that allow them to include more people in the study. In July 2022 the team published a preprint describing the 47 sequenced genomes that they had combined to create a draft “pangenome.”
They are now collaborating with researchers from around the world. “We don’t want this to be done exclusively in one place,” says Ishler. I think it is better to have genomes, especially from populations whose genetic diversity we have not identified well, and to do this in their own communities and by their own people.”
Pangenome’s effort has already paid off. Filippi is a co-author of a study published in January that identified a mechanism for a genetic abnormality. About 1 in 1,000 babies have a Robertsonian translocation, in which two chromosomes fuse together. If the genetic material is not destroyed, the health of the person is not affected, but in some cases, it can lead to conditions such as Down syndrome.
There appears to be a conserved sequence of DNA (that is, a sequence that is the same across species) that is found on multiple chromosomes. This can confuse the cellular mechanisms of DNA replication and cause chromosomes to fuse together. The critical sequence is located in a region that is both repetitive and highly variable between individuals, so it cannot be studied without multiple complete genomes.
Such findings explain why many project researchers want whole genome sequencing to be done in hospitals as well. “My ultimate goal is to be able to replicate T2T genomes in the clinic for any disease,” says Filippi. The methodology we have developed is in this direction. The cost of genome sequencing has fallen dramatically over the decades, so much so that the cost of the T2T project was much less than the cost of the original HGP.
Clearly, there is still much to learn from our genome. As new techniques reveal more secrets of the genome and make it possible to sequence more genomes, there is no end in sight. “As long as humans exist, the Human Genome Project will continue,” says O’Neill.


Noun: The total number of cases of a disease in a given statistical population at a given time, divided by the number of individuals in that population.
Noun: The quality or condition of being prevalent; wide extension or spread.
Noun: The total number of cases of a disease in a given statistical population at a given time, divided by the number of individuals in that population.
Noun: The total number of cases of a disease in a given statistical population at a given time, divided by the number of individuals in that population.
Noun: The quality or condition of being prevalent; wide extension or spread.
Noun: The total number of cases of a disease in a given statistical population at a given time, divided by the number of individuals in that population.
Noun: The quality or condition of being prevalent; wide extension or spread.
Noun: The total number of cases of a disease in a given statistical population at a given time, divided by the number of individuals in that population.
Noun: The quality or condition of being prevalent; wide extension or spread.
Noun: The total number of cases of a disease in a given statistical population at a given time, divided by the number of individuals in that population.
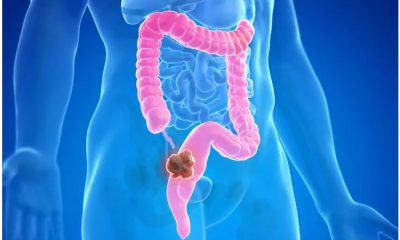
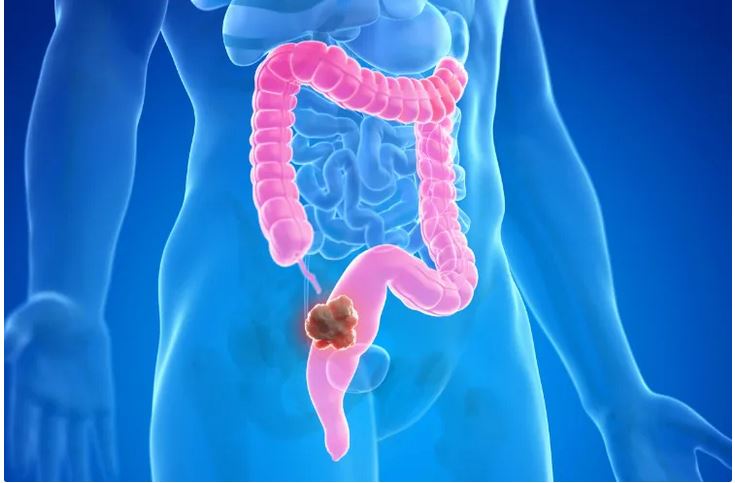
Why is the colon cancer increasing in people younger than 50?
Important points of the article:
- Doctors are seeing an increase in the number of people younger than 50 who are diagnosed with colon cancer.
- Abdominal pain changes in bowel movements and the presence of blood in stool can be warning signs of colon cancer.
- Doctors may associate symptoms such as rectal pain and bleeding and changes in bowel movements with hemorrhoids; But in some people, they indicate colon cancer.
- If colon cancer is detected early, there are good treatment options.
Many of Tejus Jayakrishnan’s patients are in their fourth or fifth decade of life. When they find out they have colon cancer, they are shocked. Sometimes, cancer that starts in the colon has spread throughout the body to the liver or lungs.
Although the number of colon cancer cases among people younger than 50 has been increasing in recent decades, symptoms in relatively young and middle-aged people may be missed, says Jayakrishnan, M.D., MD, of the Cleveland Clinic in Ohio. Doctors are usually not concerned about colon cancer in this age group, and symptoms such as pain, blood in the stool, and changes in bowel movements are attributed to other problems, such as hemorrhoids.
Christopher Liu, an oncologist at the University of Colorado Cancer Center, has the same experience. Liu noted at the annual meeting of the American Society of Clinical Oncology that by 2030, colon cancer could be the leading cause of cancer-related deaths in people aged 20 to 49.
According to ScienceNews, in 2018, the American Cancer Society updated its guidelines to take into account the changing prevalence of the disease. Now this organization recommends starting screening at 45 instead of 50.
Yin Cao, a cancer epidemiologist at the University of Washington School of Medicine, says that younger people with early-stage colorectal cancer may be overlooked; Because the age of at least 50% of the cases is less than 45 years.
Scientists do not know the reason for the increase in the prevalence of colon cancer in young people, But they have been looking for answers. Recent research has revealed some clues; However, the overall picture remains unclear.
Cao and Jayakrishnan are looking for ways to detect cancer before it spreads to other parts of the body. Cao’s team recently identified warning signs associated with early colorectal cancer.
The prevalence of early colon cancer is a global problem
Historically, in the United States, colorectal cancer has been a disease of the elderly, Cao says; But in 2017, scientists found that from 2000 to 2013, although older people still accounted for the majority of cases, the rate in people younger than 50 had increased by 22 percent. By examining data from recent decades, scientists traced the origin of the increase in cancer prevalence in the late 1980s. “The trend doesn’t seem to be reversing,” says Liu.

The trend of increasing the prevalence of colon cancer in young people can be seen more or less worldwide. Other high-income countries, including Canada, Australia, and the United Kingdom, are also witnessing this increase.
People born in recent generations are more likely to develop colon cancer compared to people born in previous generations. This situation is called the “generational effect”. Liu says that means someone turning 40 today is more at risk than someone turning 40 a decade ago.
Factors increasing the early onset of colon cancer
It is not easy to put people’s lives under the microscope and come to the conclusion about what causes their illnesses. Examining dietary history and past environmental exposures is complex; Because people cannot remember these things that belong to the past. Therefore, the picture of Zord colorectal cancer is still very unclear.
A combination of different factors may cause early colon cancer and the process of its development may be different in people
Scientists are investigating a range of possible triggers for the disease, including obesity, antibiotics, the gut microbiome, alcohol consumption, and a diet high in red meat and sugar.
Kao’s team has linked the consumption of sugar-sweetened beverages to an increased risk of early colorectal cancer in women. They reported an association between the disease and people with metabolic syndrome, which may include conditions such as high blood pressure and excess belly fat, as well as people who eat a Western diet.
Other teams have noted changes in the gut microbiome in people with early-onset disease. A 2022 study showed that the microbial community of people with an early form of colon cancer differs from the gut microbiome of people diagnosed with cancer at an older age. Although scientists are investigating the role of the microbiome in early-stage colorectal cancer, nothing is definitively established.

Four possible symptoms of early colon cancer
Although scientists have not identified a single, definitive cause for the early onset of colon cancer, they have been able to identify some early warning signs. Kao’s team reported in May in the Journal of the National Cancer Institute that affected individuals may experience abdominal pain, diarrhea, rectal bleeding, and iron deficiency anemia for up to two years before diagnosis.
The researchers analyzed the data of insurance claims of more than 27,000 affected and non-affected people. They looked for obvious symptoms recorded in people younger than 50 who were later diagnosed with cancer.
The four warning signs of colon cancer are:
Abdominal pain
Rectal bleeding
diarrhea
Iron deficiency anemia
The four symptoms Kao’s team identified appeared to be specific to early-onset cases, often appearing months to years before diagnosis. Unexplained weight loss can also be a warning sign.
Knowing the warning signs can help people stay ahead of the disease process. In a 2019 survey of about 1,200 patients and their survivors, more than 70 percent of cancer cases were diagnosed when they had spread to nearby tissues or distant organs. Patients often wait months before seeing a doctor and see multiple doctors before receiving a correct diagnosis.
Other doctors are investigating different ways to detect cancer before it spreads. If colon cancer is detected early, there are good treatment options for it.
One of the effective factors in early diagnosis may be the awareness of patients and doctors about this issue, early colon cancer is increasing. Most cases of abdominal pain are probably not cancer, But we should not simply pass them by
Noun: An acute contagious disease of the upper airways and lungs, caused by a virus, which rapidly spreads around the world in seasonal epidemics.
Noun: An acute contagious disease of the upper airways and lungs, caused by a virus, which rapidly spreads around the world in seasonal epidemics.
Noun: An acute contagious disease of the upper airways and lungs, caused by a virus, which rapidly spreads around the world in seasonal epidemics.
How did accidental release cause the 1977 Russian flu?
Summary of the article:
- In 1976, the death of an American soldier at Fort Dix due to H1N1 swine flu caused the world to fear a new pandemic. The US government started mass vaccination, but the spread of the virus stopped soon.
- A few months later, another strain, called human H1N1, was identified in Russia, which surprisingly resembled an extinct strain from the 1950s. The virus, which mainly affected young people, was less severe than expected.
- Genetic studies showed that the virus accidentally returned to circulation from laboratories associated with influenza research. Pressures from the global fear of an outbreak of the swine H1N1 virus led to the spread of a frozen virus that had been extinct years ago.
- The global disaster of the Russian flu is an important lesson in scientific mistakes and overreactions to health threats. In the face of emerging diseases, the world must act quickly, but with more caution and precision.
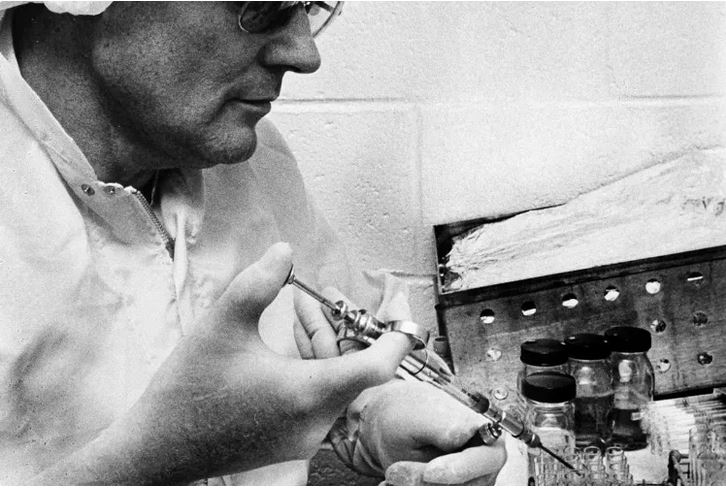
On February 5, 1976, David Lewis , a 19-year-old US Army soldier, set out with his unit from the Fort Dix base for a 80-kilometer walk. On that cold day, he suddenly fainted and died. Post-mortem tests showed that he was infected with the H1N1 swine flu virus.
Surveillance of viral diseases at Fort Dix showed that 13 other soldiers who were hospitalized due to respiratory diseases were also suffering from the same virus. Blood antibody tests also showed that more than 200 soldiers were infected with the new strain of the H1N1 swine flu virus, but did not need to be hospitalized.
The new findings suddenly sounded the alarm for the epidemiology community : was the death of soldier Lewis caused by the H1N1 strain of the swine flu virus, like the terrible pandemic of this strain in 1918, which killed about 50 million people worldwide? Could it be a sign of another global pandemic?
The US government quickly took action. On March 24, 1976, then-US President Gerald Ford announced a plan to “immunize every man, woman, and child in the United States.” On October 1, 1976, the general vaccination campaign began.
The initial outbreak of the virus at Fort Dix ended quickly
Meanwhile, the initial outbreak at Fort Dix quickly died down, and no new cases were reported at the base after February. Col. Frank Topp, who was in charge of the virus research at Fort Dix, later stated, “We clearly showed that the virus was nowhere to be seen except at Fort Dix, and that it disappeared just as quickly.”
However, concern about the outbreak and the observation of the widespread vaccination program in the United States prompted biomedical scientists around the world to begin research into the development of an H1N1 vaccine. As the world headed into the winter of 1976 and 1977, everyone was expecting the H1N1 swine flu to hit the world, but it never happened.
But the story did not end there. According to experienced epidemiologists in the field of infectious diseases, seemingly logical but ultimately unnecessary preparations have unintended consequences.
 September 1976: New York State Department of Health workers unload cartons of swine flu vaccine for distribution.
Photographer: Jim McKnight/AP Photo
Strange features of the virus
Suddenly, a new strain of influenza virus appeared in an epidemiological twist. But this virus was not the expected swine H1N1 strain.
In November 1977, health officials in Russia reported that a human strain of the H1N1 virus had been detected in Moscow. By the end of the month, the outbreak of the virus was reported throughout the Soviet Union and soon spread throughout the world.
The pandemic of the new strain had very strange characteristics compared to other strains of influenza:
- The first strange feature: the death rate was very low. The death rate of this strain was about one-third of other influenza strains.
- The second strange feature: only people under the age of 26 were regularly infected with this virus. The virus did not affect the elderly as much as the young.
- Third oddity: Unlike other new pandemic viruses, this virus was unable to kill the H3N2 strain that was prevalent that year as the seasonal flu. Instead, both the new H1N1 strain and the old H3N2 strain were circulating and spreading at the same time.
Finally, the story took another twist. Microbiologist Peter Pillis used an innovative technique called oligonucleotide RNA mapping to study the genetic makeup of the new Russian H1N1 strain. This method allowed him to classify the genes of the virus-like fingerprints.
Pillis and his colleagues grew the virus in the lab and then, using RNA-cutting enzymes split the virus’s genome into hundreds of pieces. By spreading these fragments in two dimensions based on size and electrical charge, the RNA fragments created a unique fingerprint-like map.
 Researchers were surprised to see the “genetic fingerprint” of the H1N1 strain of Russian influenza in 1977. The pattern of this strain was consistent with an extinct virus.
Surprisingly, after comparing the genetic fingerprint pattern with other flu viruses, the researchers found that the “new” Russian H1N1 strain was virtually identical to the old strains of the human H1N1 virus that had died out in the early 1950s.
Therefore, the Russian influenza virus of 1977 was actually the same strain that became extinct about a quarter of a century ago, but somehow, it had returned to the life cycle. This also explained the reason why the virus attacked young people. Older people had already been infected with the virus in the past and were immune to it when it re-released. But how did an old and extinct strain re-emerge?
Time and place of virus outbreak
Despite the identification of the virus strain as “Russian flu”, it is possible that the spread of this virus did not actually originate from Russia. The first reports of the detection of the virus were announced in Russia, but later reports from China indicated that the virus had been detected months earlier, in May and June 1977, in the port city of Tianjin in China.
In 2010, scientists discovered the “footprint of China”.
In 2010, using detailed genetic studies of several samples of the 1977 virus, scientists were able to determine the most precise date of the common ancestor of these viruses. Molecular clock data showed that the virus had probably infected humans a year earlier, in April or May 1976.
Therefore, the best evidence shows that the 1977 Russian influenza virus was actually released in or near Tianjin, China, in the spring of 1976; Or more precisely, “returned from extinction and re-emerged”.
 Although the resurgent virus was named Russian flu, it appears to have circulated elsewhere before being identified in the Soviet population.
Laboratory frozen virus
But was it just a coincidence that within months of Private Lewis’s death from H1N1 swine flu, a strain of the extinct flu virus suddenly re-emerged in human societies?
Influenza virologists have used freezers for years to store influenza virus strains, including some that have become extinct in nature. Fear of a new world swine H1N1 outbreak in the United States in 1976 led to increased research on H1N1 viruses and vaccines worldwide. An accidental release of one of these stored viruses was entirely possible in any of the countries conducting H1N1 research, including China, Russia, the United States, the United Kingdom, and possibly others.
Thousands of soldiers in China had been tested for the live virus
Years after the re-emergence, Peter Pillays disclosed his personal conversations with Chi Ming-Chu, a prominent influenza expert in China. “It is now believed that the introduction of the H1N1 virus in 1977 was the result of vaccination experiments in the Far East, during which thousands of soldiers were tested with live H1N1 virus,” Pillays wrote in 2004.
Although it is unclear how the accidental release event occurred during vaccine testing, there are two main possibilities: First, scientists may have used the revived H1N1 virus as a starting material to make a live, attenuated H1N1 vaccine. If the virus in the vaccine was not weakened enough, it could be passed from person to person. Another possibility is that the researchers used the revived virus to test the safety of influenza vaccines in human societies and the virus accidentally leaked from the laboratory environment.
Whatever the specific mechanism of the spread of the virus, the combination of the exact place and time of the beginning of the spread and the position of people like Chou and Pilis as very reliable and reliable sources provide strong reasons to believe the story of the accidental spread of the virus in China as the main source of the spread of the Russian flu.
 The H1N1 influenza virus detected at Fort Dix was not the virus that ended up causing the disease.
Lessons from history
The return of the deadly human H1N1 virus from extinction comes as the world is scrambling to contain the seemingly imminent H1N1 swine flu pandemic. People’s concern about the possibility of a new world birth indirectly caused an extinct virus to reappear and cause another world birth.
In fact, despite the uncertainty of scientists in 1976 and the increasing global anxiety about the outbreak of a pandemic disease, any research unit anywhere in the world could accidentally release the virus that later became known as the Russian flu. In the global rush to prevent the potential spread of H1N1 swine flu from Fort Dix through research and vaccination, such events could have occurred anywhere.
Overreaction, unintended consequences, aggravation, self-fulfilling predictions; There are different terms to describe such a phenomenon. These terms show how the best intentions can backfire.
Of course, biosecurity facilities and policies have improved dramatically over the past half-century. Meanwhile, the number of high-security laboratories around the world has also greatly increased.
After the introduction of COVID-19, the world is now facing new threats from bird flu viruses, monkeypox virus, and other pathogens. It is important to respond quickly to these emerging threats to prevent another global catastrophe. The reaction should be fast, but not too fast. As history shows us and as this historical.
usPronoun: me and at least one other person; the objective case of ‘we’.
Pronoun: me.
Pronoun: our.
Pronoun: Me (in all contexts).
Determiner: The speakers/writers, or the speaker/writer and at least one other person.
Symbol: : microsecond
۴۰Pronoun: me and at least one other person; the objective case of ‘we’.
Pronoun: me.
Pronoun: our.
Pronoun: Me (in all contexts).
Determiner: The speakers/writers, or the speaker/writer and at least one other person.
Symbol: : microsecond
The wonderful world of ultrasound
Ultrasound imaging is a non-invasive imaging method that is used in many medical fields. From diagnosing cardiovascular diseases and examining fetal growth during pregnancy to evaluating tumors and examining joints, ultrasound is considered an extremely valuable tool for doctors; Especially since ultrasound does not use X-rays, it is a more suitable method for patients of any age group, including pregnant women.
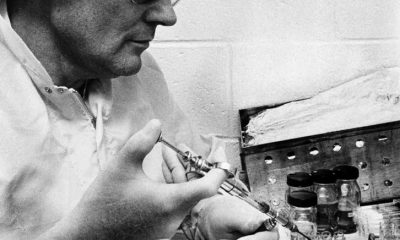
During World War I, French scientists used ultrasonic waves to locate enemy submarines. The use of ultrasound waves was considered a great achievement at that time. In 1956, Professor Ian Donald (Glasgow Royal Maternity Hospital) was the first to use ultrasound for medical diagnosis and measurement of fetal head diameter.
 Ian Donald, a pioneer in the use of ultrasound for medical diagnosis
This act was a turning point in the development of ultrasound as a practical tool in medical diagnosis, pregnancy care, and fetal health. Since then, ultrasound has become one of the most common and safest methods in diagnosing and monitoring the condition of the fetus during pregnancy. In ultrasound, we use ultrasound waves to image the internal organs of the body.
In this article, we will first get acquainted with the physics governing the ultrasound machine, then we will talk about imaging with it.
Physics governing the ultrasound machine
Sound is a type of mechanical energy and it needs a material environment (solid, liquid, and gas) to be transmitted from one point to another and it is transmitted through pressure waves. The number of oscillations or vibrations (cycle of movement) of the particles of the environment per second is called frequency, which is one of the important characteristics of sound waves.
Sound waves are transmitted to nearby molecules through the vibration of molecules and their pressure changes. This transfer is done mechanically through a process called diffusion. As we said, sound waves, unlike electromagnetic waves such as X-rays, need a material and elastic medium to propagate. Electromagnetic waves can travel through a vacuum, but sound waves need a material to travel through.
Sound travels at different speeds in different environments due to different physical characteristics. For example, sound waves travel faster in solid media than in liquids and gases because the molecules of solids are closer together and energy is transferred more efficiently. Therefore, the speed of sound in a solid substance is about 6000 m/s, in a liquid with a temperature of 20 degrees Celsius it is about 1481 m/s and in air, it is about 343 m/s.
Sound waves travel faster in solid materials
Let us explain this process with a simple example to better understand the propagation of sound waves in the environment. Suppose you have a speaker or a microphone and you are giving a speech to a crowd. When playing sound from the speaker, its diaphragm moves forward and backward. The vibrating movement of the diaphragm causes compression and condensation of air molecules near it. This means that the vibration of the diaphragm also vibrates the air molecules and this vibration will be transmitted to the nearby molecules.
 Vibration of air molecules near the speaker
As you can see in the image above, the air molecules near the speaker (sound source) oscillate in a sinusoidal fashion. As we said, the ultrasound machine takes pictures of the internal organs of the body with the help of ultrasound waves. Ultrasound waves are sound waves that oscillate at frequencies higher than 20,000 Hz; That is, higher than the range of frequencies that the human ear can detect (between 20 and 20,000 Hz). Some animals, such as owls, can naturally produce ultrasonic waves and use them for communication and echolocation.
Echolocation is a method that bats use to find their way and identify objects or other animals in the environment. By producing an ultrasonic wave, the bat sends it to its surroundings. After hitting different objects, the sent wave becomes an echo and reaches the bat. After receiving the reflected wave, the bat identifies the location and distance of the objects by analyzing the return time and sound intensity.

Suppose we have two different environments, such as air and water, and the ultrasonic wave, moving from air to water, hits their separating boundary. what happens A part of the wave is reflected from the boundary separating the two environments and a part of it enters the water after crossing the boundary. This is called partial reflection because only part of the radiated wave is reflected. Therefore, whenever the ultrasonic wave hits the boundary separating two environments, part of it is reflected and another part enters the second environment.
Now suppose we shine ultrasound waves on an object that has different boundaries, therefore, a part of the waves will return to us after hitting each boundary. By knowing the speed of sound waves and the duration of their reflection, we can get the distance of each border. This mode is similar to when a bat uses ultrasound waves to determine the distance between different objects. By collecting and examining all the reflected waves, we get information about the different boundaries inside the object and its structure.
The important question is what factors determine the speed of sound waves in the environment. The density of the environment is one of the factors that determine the speed of sound. The denser the environment, the slower the sound travels in it. Also, the more compressible the medium, the slower the speed of sound in that medium. In addition to density and compressibility, the hardness of the environment also affects the speed of sound movement in the environment; More difficulty, more speed.
Here we come to a paradox. At the beginning of this section, we mentioned that sound travels faster in a solid than in a gas or liquid. But solid density is higher than liquid and gas! We must pay attention to the fact that the effect of each factor on the speed of sound is not the same and the effect of density on speed is less than the effect of compressibility. For example, although the density of mercury is 13.5 times that of water, sound travels at about the same speed in water and mercury. The reason for this is due to the compressibility of water 13.4 times compared to mercury.
This is very helpful in ultrasound imaging. When imaging soft tissues inside the body, we assume that sound travels at a constant speed inside all body tissues (such as the liver and kidney); Of course, the speed of sound is different in human tissues. For example, its amount in breast tissue is about 1430 m2 and in muscles about 1647 m2. Despite these differences, ultrasound machines usually use a fixed speed (1540 m/s) to reconstruct the images.
So far, we have learned about the physics governing the ultrasound machine. Next, we will talk about imaging with this device.
Ultrasound imaging
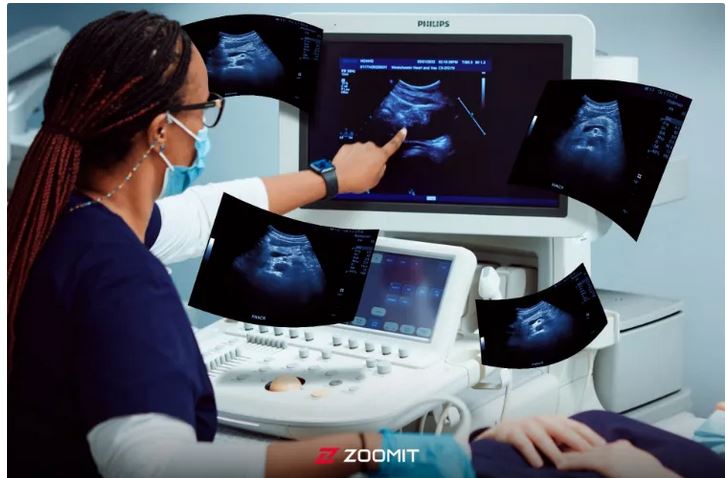
In the ultrasound machine, we use a device called “Transducer” for imaging. A transducer is a device that converts energy from one form to another. In ultrasound, with the help of transducers, we send sound waves into the body and receive reflected waves from internal tissues. These returning waves are converted into images that doctors use to examine the organs and internal tissues of the body.
For imaging, the doctor places the transducer on the skin as shown in the image below. Next, the transducer receives electrical energy and converts it into sound energy. After reaching the tissues, a part of the sent sound wave is reflected from them and hits the transducer. In other words, after sending a sound wave (sound pulse) into the body, the ultrasound device waits for the return or echo of that wave from the body tissues.

Based on the time required for the reflected waves to reach the transducer, the device calculates the exact location of the reflected waves (distance or depth from where the wave comes) and creates a corresponding pixel in the image. By repeating this process continuously, a two-dimensional image of the cross-section of tissues is formed.
The device simply calculates the depth or distance. We assumed the speed of sound to be constant in different tissues. Therefore, by measuring the time of sending, reflecting a part of the sound wave from the tissue, and reaching it again to the transducer, we can easily obtain the distance from which the wave was reflected. According to the intensity of the wave reaching the transducer, we can determine the brightness of the pixel.
According to the time of arrival of the waves reflected from the tissues to the transducer, we can obtain the location of the tissues.
Ambient temperature also affects the speed of sound; The higher the temperature, the faster the sound wave travels. But this case does not affect the imaging with ultrasound waves, because we can consider the body temperature to be constant with a good approximation.
In order to have a better understanding of ultrasound imaging, we need to get to know the behavior of these waves inside the body tissues. How ultrasound waves interact with the internal tissues of the body plays an important role in the created images. In the following, we will talk more about this.
Interaction of ultrasound waves with internal body tissues
As we mentioned in the previous section, part of the ultrasound waves are reflected after reaching the boundary separating the two environments. This happens when this wave hits the internal tissues of the body. The texture border separates two different textures from each other. Ultrasound waves can reach fat after passing through muscle. We call the border between muscle and fat, tissue border.
When ultrasound waves hit the boundary between tissues, any of the following situations may occur:
- A part of the wave radiated to the boundary passes through it and the rest is reflected from the boundary.
- All the wave that hits the boundary is reflected from it in the direction of the radiated wave.
- The radiated wave is reflected from the boundary of two tissues in a mirror or non-mirror form.
- The wave radiated to the boundary of the tissue is scattered inside it. This state occurs when the constituent units of the tissue are smaller than the wavelength of the irradiated ultrasound. In this case, most of the wave energy radiated to the tissue is lost and a part of it is spread in all directions.
 Types of interaction of ultrasound waves with tissue
What determines the type of interaction of ultrasound waves at the tissue boundary is called “acoustic impedance with acoustic resistance” (Acoustic Impedance or Z). Acoustic impedance is an inherent property of every tissue and is obtained from the product of tissue density and the speed of sound movement inside that tissue. In simple words, acoustic impedance indicates the resistance of a material to the passage of sound waves through it.
Suppose we send the ultrasound pulse to a specific tissue inside the patient’s body. When the pulse reaches the boundary of the tissue, it encounters another tissue with a different acoustic impedance. The value of the acoustic impedance difference between the two tissues determines the value of the ultrasound wave passing through the boundary and the value of the reflected wave (echo). The table below shows the sound impedance of different environments.
|
Material |
speed (ms) |
Acoustic impedance |
|---|---|---|
|
air |
330 |
6^10 × 0,0004 |
|
lung |
600 |
6^10 × 0٫18 |
|
fat |
1450 |
6^10 × 1,34 |
|
water |
1480 |
6^10 × 1,48 |
|
soft texture (medium) |
1540 |
6^10 × 1,62 |
|
muscle |
1600 |
6^10 × 1,71 |
|
bone |
4080 |
6^10 × 7,8 |
As you can see in the table above, the amount of sound impedance in water and bone is significantly different from each other. If the acoustic impedance values of two tissues are very close to each other (such as fat and water), most of the ultrasound wave will pass through the boundary of the two tissues, and a small amount of it will be reflected as an echo. On the other hand, if the acoustic impedance values of two tissues are very different from each other (such as muscle and bone), most of the ultrasound wave will be reflected from the boundary of the two tissues and a small amount of it will pass through the boundary.
Reflection of ultrasound waves from tissue
As we mentioned in the previous section, due to the difference in acoustic impedance between the two tissues, part of the ultrasound waves pass through the border and another part is reflected perpendicularly to the border, in a mirrored, regular, or irregular way. Vertical reflection occurs when the boundary of the tissue on the radiating ultrasound wave is perpendicular and the boundary is also large and flat. This condition can occur in the renal capsule. Due to the difference in the acoustic impedance of the fat around the kidney and the kidney tissue, some of the radiated ultrasound waves is reflected and reach the transducer.
In some cases, all the ultrasound waves radiated to the tissue are reflected from it. This case occurs in a case where the difference in acoustic impedance between the two environments is very large. For this reason, we cannot take pictures of the lungs with the help of ultrasound waves, because the air inside the lungs has a much lower acoustic impedance compared to the surrounding soft tissue.
In some cases, instead of vertical radiation, the ultrasonic wave hits a flat and large surface with a specific angle. In this case, regular or mirror reflection occurs as shown below. When a surface is smooth (such as a mirror or the surface of a bone), sound waves are reflected in a specific and regular direction instead of being scattered in different directions. This is similar to the reflection of light from a mirror, where the light is reflected directly at a certain angle and not diffusely.
 Regular or specular radiation
In most cases in regular irradiation, the reflected ultrasound beam does not return to the transducer. Fortunately, most large surfaces inside the body are not perfectly flat and smooth and do not reflect ultrasound waves in a mirror-like fashion. As a result, irregular or non-specular reflection occurs most of the time. In this case, the reflected wave is reflected in different directions. The intensity of the vertically reflected wave is much stronger than the irregularly reflected wave.
About 59% of the ultrasound waves radiated to the bone pass through it and 41% are reflected, but we cannot see the images of the tissues behind the bones with the help of ultrasound waves. The reason for this is that the amplitude of ultrasound waves decreases after entering the bone and moving through it.
Refraction of ultrasound waves from tissue
In the previous section, we learned about the reflection of ultrasound waves from body tissues. If the ultrasound wave hits the boundary of two tissues with a certain angle, after interacting with the tissue boundary, part of it will be reflected from it and another part of the boundary will pass and enter the second environment with a different angle (larger or smaller) than the radiation wave. . In this case, instead of the value of the wave transmitted or reflected from the boundary, we obtain the angle change by changing the speed of the ultrasonic wave in each environment.
 Changing the angle of the ultrasonic wave based on its speed in different environments
Dispersion and reduction of the amplitude of ultrasound waves
When ultrasound waves interact with internal body tissues, they are reflected, scattered, or passed through them. Also, the amplitude of ultrasound waves decreases when entering bone or other tissues. Scattering occurs when the wavelength of the wave when hitting an object or part of it is smaller than the dimensions of that object.
When the ultrasonic wave passes through an environment with dimensions larger than its wavelength, it will pass without scattering. If the environment consists of components with dimensions smaller than the wavelength of the ultrasound beam, scattering occurs. As a result, the amplitude and intensity of ultrasound waves are reduced when passing through such environments (such as bone).
 Dispersion of ultrasound waves
The lower the density of areas with dimensions smaller than the ultrasonic wavelength, the greater the scattering. Scattering is one of the main factors in creating the “echogenicity” of the tissue or the ability of the tissue to reflect sound waves. The greater the dispersion, the greater the echogenicity. In other words, the structures inside the tissue that cause the scattering of the waves help create a clearer image in the ultrasound.
Unlike ultrasound imaging, in X-ray imaging, we are not interested in scattering. When the ultrasound wave passes through a tissue such as the kidney, it is scattered by its smallest constituent units and a part of it reaches the transducer. Although the waves reaching the transducer are noisy and not very regular, they give us information about the kidney or any other tissue.
In addition to scattering, heat generation in tissues can also reduce the amplitude of ultrasound waves. Ultrasound waves may be absorbed by tissues as they pass through them, leading to heat generation. The attenuation of ultrasound waves varies from one tissue to another and depends on the attenuation coefficient of each tissue and the frequency of the ultrasound wave.
|
texture |
Tissue attenuation coefficient |
|---|---|
|
water |
0,0002 |
|
blood |
0,18 |
|
soft texture |
0,3-0,8 |
|
liver |
0,4-0,7 |
|
fat |
0,5-2 |
|
tendon |
1 |
|
bone |
20 |
|
lung |
40 |
Suppose we send an ultrasound wave with a frequency of 4 MHz from the transducer to one of the internal tissues of the body. After traveling a distance of 5 cm, this wave reaches the boundary of the tissue shown in the image below. The intensity of this wave after traveling a distance of five centimeters and reaching the border of the tissue becomes about one tenth. After reaching the boundary, the wave reflects and moves towards the transducer.
The intensity of the wave after reflecting from the boundary and reaching the transducer also decreases by another tenth. As a result, the wave reaching the transducer is about one hundredth of the original ultrasonic wave. Of course, this is the case if the ultrasonic wave is perpendicular to the boundary and all of it is reflected.

Transducer and its components
So far, we have learned about the interaction of ultrasound waves with the internal tissues of the body. In the ultrasound machine, the transducer receives the reflected waves by producing ultrasound waves and irradiating them to the tissues. The reflected waves are converted to a digital signal by the transducer and then analyzed.
The piezoelectric material in the transducer is responsible for creating ultrasound waves and sending these waves to the body tissues. Also, this part receives reflected and scattered ultrasound waves from tissues and converts them into electrical signals. As you can see in the picture above, the piezoelectric material is located in front of the transducer.
The piezoelectric material has a unique feature; Squeezing this material induces an electric current and the current passing through it causes the material to vibrate and move. In the ultrasound machine, sound waves hit the piezoelectric material between two electrodes and compress it. This compression creates an electric current corresponding to the intensity and frequency of the sound waves, which will be transmitted as a signal to the ultrasound machine.
At the same time, the ultrasound device can cause the piezoelectric material to vibrate and produce sound waves by applying an electric current. This feature allows the ultrasound device to convert signals received from the body into images and send sound waves to examine body tissues. Electrodes also play an important role in enhancing the piezoelectric effect and conducting electric current.
The piezoelectric material in the transducer is responsible for creating ultrasound waves
Piezoelectric crystals are the beating heart of ultrasound transducers. Each of these crystals acts like a small spring that sends sound waves at a certain angle to the body and receives the reflected waves from that angle. This feature allows the device to create a 2D and in some cases 3D image of the body’s internal structures.
An array of crystals is used to improve image resolution, especially in the horizontal direction (side-to-side resolution). Using these arrays, the ultrasound machine can detect very small details such as small blood vessels or the internal structures of organs in the body tissues. In addition to the number of crystals, other factors such as the frequency of sound waves, the angle of radiation, and image processing techniques are also influential in the quality of the final image.
In ultrasound, we use different transducers with different frequencies. We cannot easily change the frequency of transducers, because two factors determine the frequency value:
- Speed of sound passing through piezoelectric material
- The thickness of the piezoelectric material
The smaller the thickness of the piezoelectric material, the higher the frequency of the emitted wave. The depth of penetration of waves with different frequencies is different. Waves with smaller frequencies have a lower penetration depth and waves with larger frequencies have a greater penetration depth.
In ultrasound, we use different transducers with different frequencies to take images of tissues
The speed of sound in piezoelectric material is much higher than the speed of its movement in body tissues. As a result, these two environments (piezoelectric material and tissue boundary) have a high acoustic impedance difference. The large difference in acoustic impedance between these two environments causes a large part of the energy of sound waves to be wasted when passing through the crystal to the body. The adaptation layer in the transducer prevents the loss of energy of the sound waves during transmission from the piezoelectric material to the internal tissues of the body.
As you can see in the image above, the matching layer is located on the front of the transducer and protects the piezoelectric crystals and internal body tissues. Also, the acoustic impedance of this layer is a number between the acoustic impedance of the piezoelectric material and the internal tissues of the body. The adaptation layer, by adjusting and adjusting the audio impedance, increases the transmission of waves and improves the quality of the ultrasound image.
Our skin is not a perfectly smooth surface, so the matching layer can’t sit on it very well. Hence, some air is trapped between the matching layer and the texture. The acoustic impedance of air is very small, as a result, the acoustic impedance difference becomes very large and the sound waves cannot be easily transmitted from the transducer to the tissue. “Coupling Gel” is used to solve this problem.
Coupling gel is a water-based material with acoustic impedance close to the tissue, which is placed between the transducer and the patient’s skin, and its main function is to remove air between the probe and the skin. By removing the air, the gel causes better transmission of sound waves from the device to the body and vice versa. This helps create clearer and more detailed images of the inside of the body.
So far, we got acquainted with the piezoelectric material and the matching layer that is placed in front of the transducer. With a little distance from the front of the transducer and before the piezoelectric material, we reach a part called damping. The main purpose of attenuation is to improve image quality and reduce noise. As we said, ultrasound waves are produced by the vibration of piezoelectric material with a specific frequency. The vibration of the piezoelectric material continues for a certain period of time, but the damping part can shorten the period of its oscillation.
When the piezoelectric material contracts and expands, part of the generated waves move towards the patient and another part returns to the transducer. The damping piece prevents the generated waves from returning to the transducer and directs them to the target tissue.
So far, we have learned about the interaction of ultrasound waves with the internal tissues of the body and the internal structure of the transducer. In the following, we will talk a little about the details of imaging with ultrasound waves in the ultrasound machine.
Image formation in the ultrasound machine
The ultrasound image is a cross-section of the patient’s body, which is formed line by line in front of the transducer. The transducer sends ultrasound waves to the internal tissues of the body. After hitting different tissues, the sent waves are reflected from them and hit the transducer. Each line of the image is created based on these reflections and in this order, with the movement of the transducer on the body, successive lines are formed and the final image is made of the internal structure of the body.
In the following, we will examine together how the image of the kidney (right kidney) is formed in the ultrasound machine. First, an electric current is applied to the transducer and the piezoelectric material, and an ultrasonic wave is created. As we said, the ultrasound wave moves at a speed of about 1540 meters per second inside the body tissues. Part of the ultrasound waves, upon reaching the internal structure of the kidney and the tissue border, are reflected and move toward the transducer. The black-and-white image of the kidney is produced after processing the reflected waves. Because sound travels at a certain speed, the ultrasound machine can interpret the received signals and show the structures exactly where they are located on the monitor.

In ultrasound, the depth of the structures in the tissue is directly related to their position in the image. Ultrasound waves reflected from structures close to the surface of the tissue reach the transducer earlier, so they are displayed in the upper parts of the image. In contrast, deeper structures need more time to send and receive sound waves, so they will appear in the lower parts of the image. This basic principle in ultrasound allows us to view a cross-section of the body and estimate the depth of each structure relative to the surface of the skin.
Read more: High blood pressure: symptoms, prevention and treatment
As we mentioned in the previous sections, tissues are heated by absorbing ultrasound waves, and the amplitude of these waves decreases with increasing depth of penetration. Therefore, it is more difficult to see deeper structures on ultrasound, because the ultrasound waves are too weak to reach them. To compensate for this attenuation, most ultrasound systems use a feature called “Time Gain Compensation” (TGC). TGC amplifies the return signals from deeper layers so that we can have better and clearer images of deeper structures.

Some structures, such as bones, are strong reflectors of ultrasound waves, and most of the ultrasound waves irradiated to them are reflected. In this case, the acoustic shadow is created as shown in the image below.
 Acoustic shadow formed by diseased ribs
As we mentioned in the previous sections, ultrasound waves are scattered after hitting a heterogeneous surface. Dispersion of ultrasound waves in the body tissues leads to the appearance of speckles in ultrasound images. These stains may reduce image resolution and make it harder to accurately identify structures.

Brl
Frequency greatly affects the resolution of images taken with ultrasound waves. Ultrasound waves with a smaller frequency can travel a greater distance inside the body and penetrate the deep structures of the body better than ultrasound waves with a larger frequency. In contrast, higher-frequency ultrasound waves are suitable for imaging surface structures. As a result, to get the best image of the internal organs of the body, we must choose a transducer with a suitable frequency.
The ultrasound waves used in ultrasound have turned from a war tool to track submarines into one of the main pillars of medical diagnosis. Ultrasound technology allows us to penetrate deep into our body without pain or risk. From diagnosing cardiovascular diseases to examining the growth of the fetus in the mother’s womb, ultrasound plays a vital role in maintaining human health.
The future of ultrasound is very bright with significant advances in imaging technologies and artificial intelligence. 3D and 4D ultrasound can provide more detailed images of internal body tissues and organs. Artificial intelligence will also be used as a key tool in faster and more accurate analysis and interpretation of images and can reduce human error.
Also, a portable ultrasound that can be used at home makes access to this method easier for doctors and patients even in remote areas. The use of augmented reality and virtual reality technologies in ultrasound will also make it possible to analyze images interactively and in more detail.
Finally, it can be predicted that ultrasound will revolutionize medical diagnosis and treatment in the future with higher accuracy, wider access, and more diverse applications.

Ancient humans survived the last ice age just fine

iPhone 16 Pro Review

Why is the colon cancer increasing in people younger than 50?

Why is it still difficult to land on the moon?

Biography of Geoffrey Hinton; The godfather of artificial intelligence

The Strawberry Project; The OpenAI artificial intelligence model

Everything you need to know about the Windows Blue Screen of Death

Starlink; Everything you need to know about SpaceX Satellite Internet

iOS 18 review: A smart update even without Apple’s intelligence

James Webb vs. Hubble
-
 Technology1 year ago
Who has checked our Whatsapp profile viewed my Whatsapp August 2023
-
Technology1 year ago
Second WhatsApp , how to install and download dual WhatsApp August 2023
-
Technology1 year ago
How to use ChatGPT on Android and iOS
-
AI2 years ago
Uber replaces human drivers with robots
-
Technology1 year ago
The best Android tablets 2023, buying guide
-
Technology1 year ago
The best photography cameras 2023, buying guide and price
-
Humans2 years ago
Cell Rover analyzes the inside of cells without destroying them
-
Technology1 year ago
How to prevent automatic download of applications on Samsung phones