Space
Why is Jupiter one of the first targets of the James Webb Space Telescope?
Why is Jupiter one of the first targets of the James Webb Space Telescope?
Astronomers around the world are eagerly awaiting the launch of James Webb, the world’s most powerful space telescope. Launched on 4D 1400, the telescope has advanced its opening process to its final stage, reaching its final orbit around the Sun and aligning its mirrors with its primary camera, but there are still steps to be taken, such as calibrating instruments for scientific use.
This summer, scientific observations of James Webb will begin. This is where things get more exciting; Because the high sensitivity of the telescope and its infrared capabilities make it possible to observe distant objects, especially fainter ones that are more difficult to observe with current space telescopes such as Hubble. Also, James Webb will mark a new era in the field of astronomical observations and will help to investigate topics such as the formation of the first galaxies and the atmosphere of exoplanets.
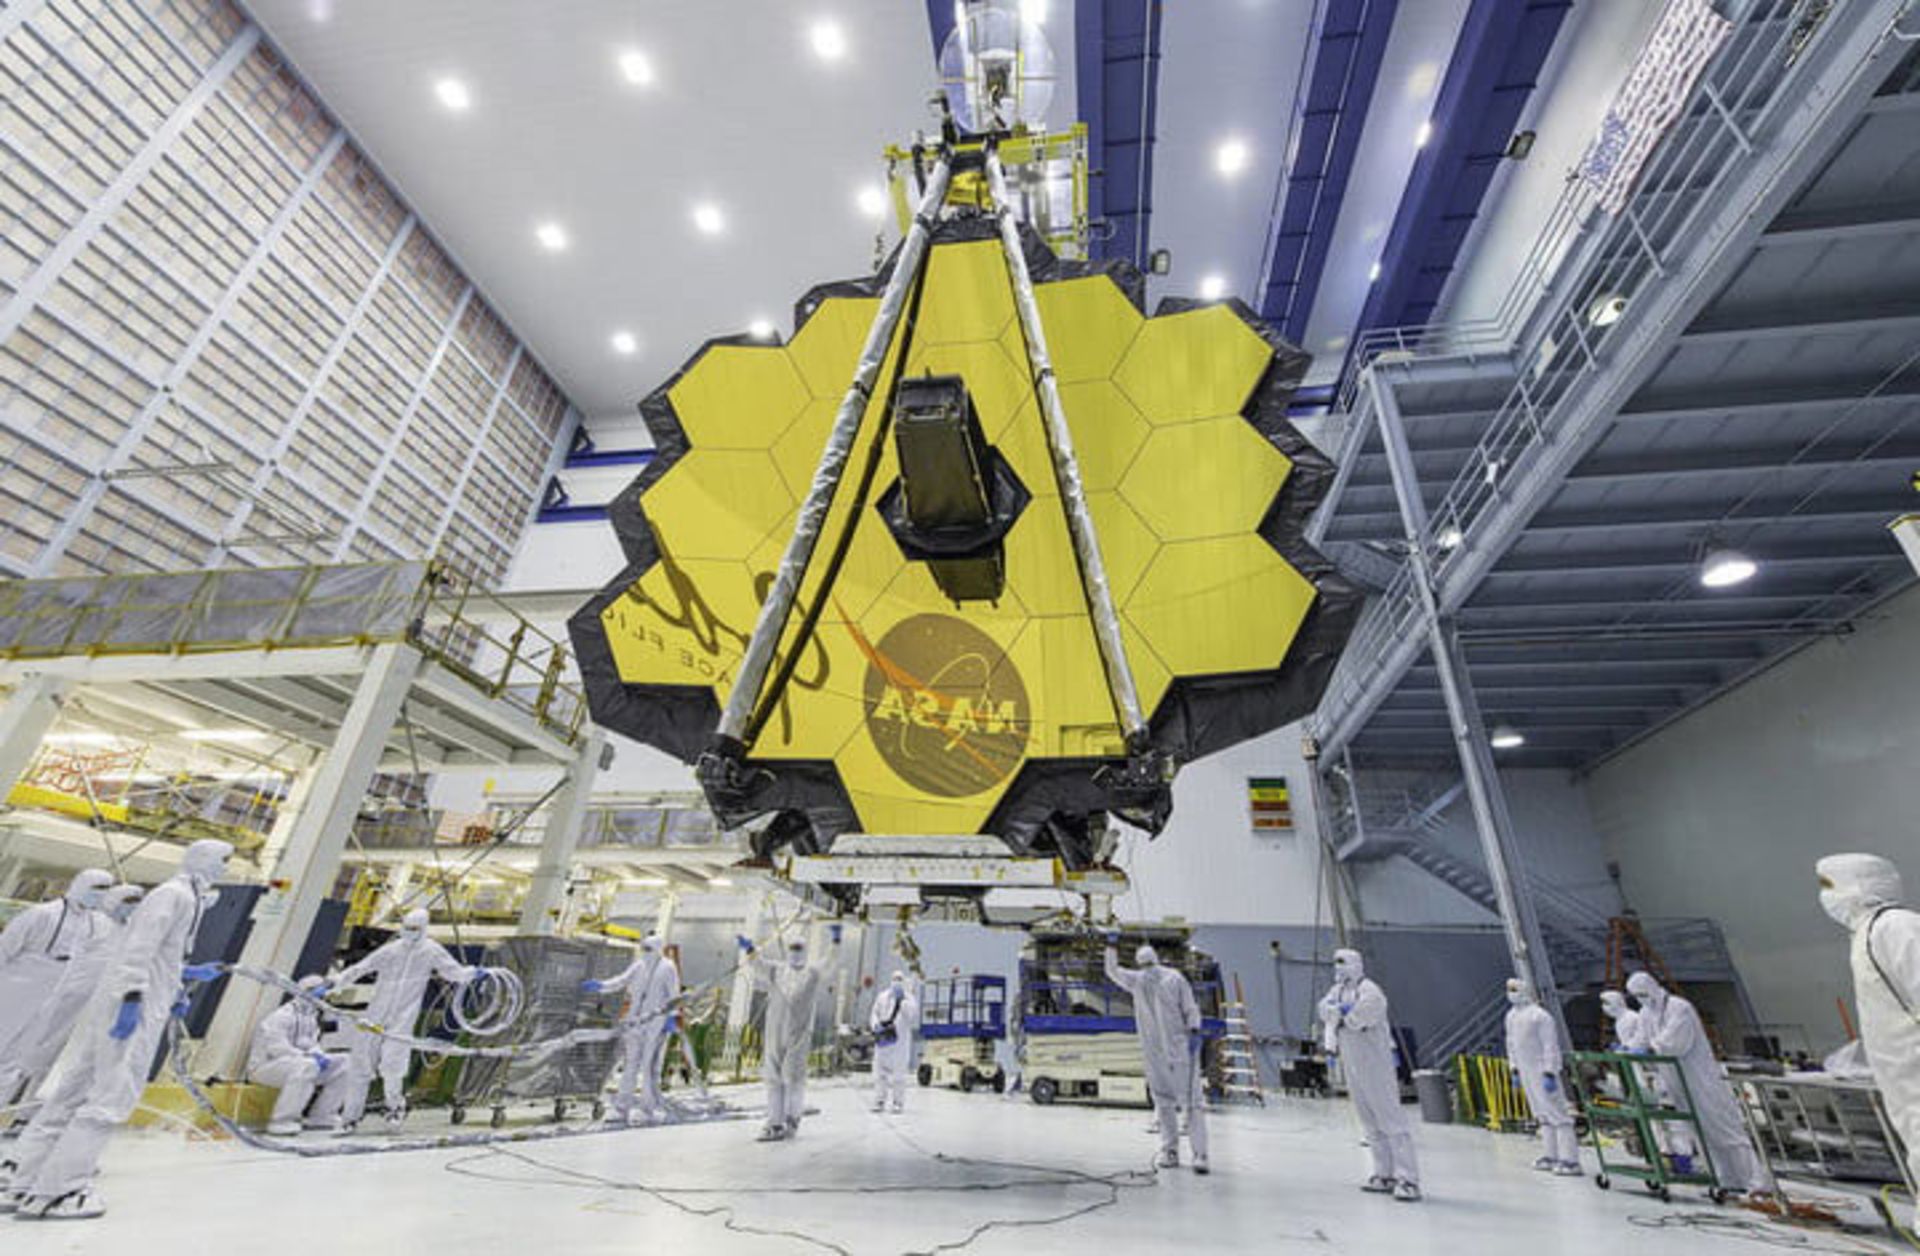
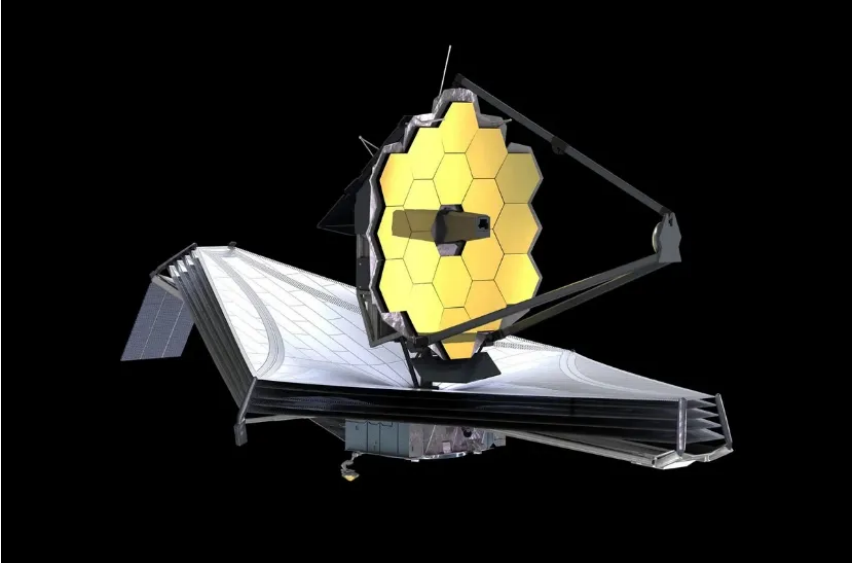
NASA technicians lift James Webb using a crane and place him in a clean room at NASA’s Goddard Space Center in Greenbelt, Maryland. James Webb is the most powerful telescope ever built.
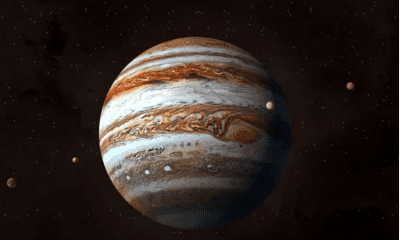
Thirteen projects have been selected to test the capabilities of the James Webb telescope in its first five months of operation, and as you can imagine, the competition for the first projects was fierce. Most of the projects are dedicated to the study of distant objects such as black holes and galaxies; But one project has chosen a closer target: the planet Jupiter; But why did the researchers choose this gas giant?
A complete system to review
Compared to distant exoplanets and even the most distant ice giants in the solar system, astronomers know a lot about Jupiter. Also, thanks to observations from ground-based telescopes and space missions such as Galileo, which orbited Jupiter until 2003, and the Juno probe, which is still orbiting this planet, we have a wealth of information about the largest world in the solar system. But like any scientific research, any data we get about the customer can lead to more answers. According to Imke Dipater, an astronomer at Berkeley and head of the Jupiter Observations team:
So far, we have traveled to Jupiter with several probes. We also examined this planet with the Hubble Space Telescope and a large number of ground-based telescopes in different wavelengths of the electromagnetic spectrum (from ultraviolet to light wavelengths); As a result, we learned many things about this planet, its atmosphere, internal structure, as well as its moons and rings; But the more data you get, the more there is to learn.
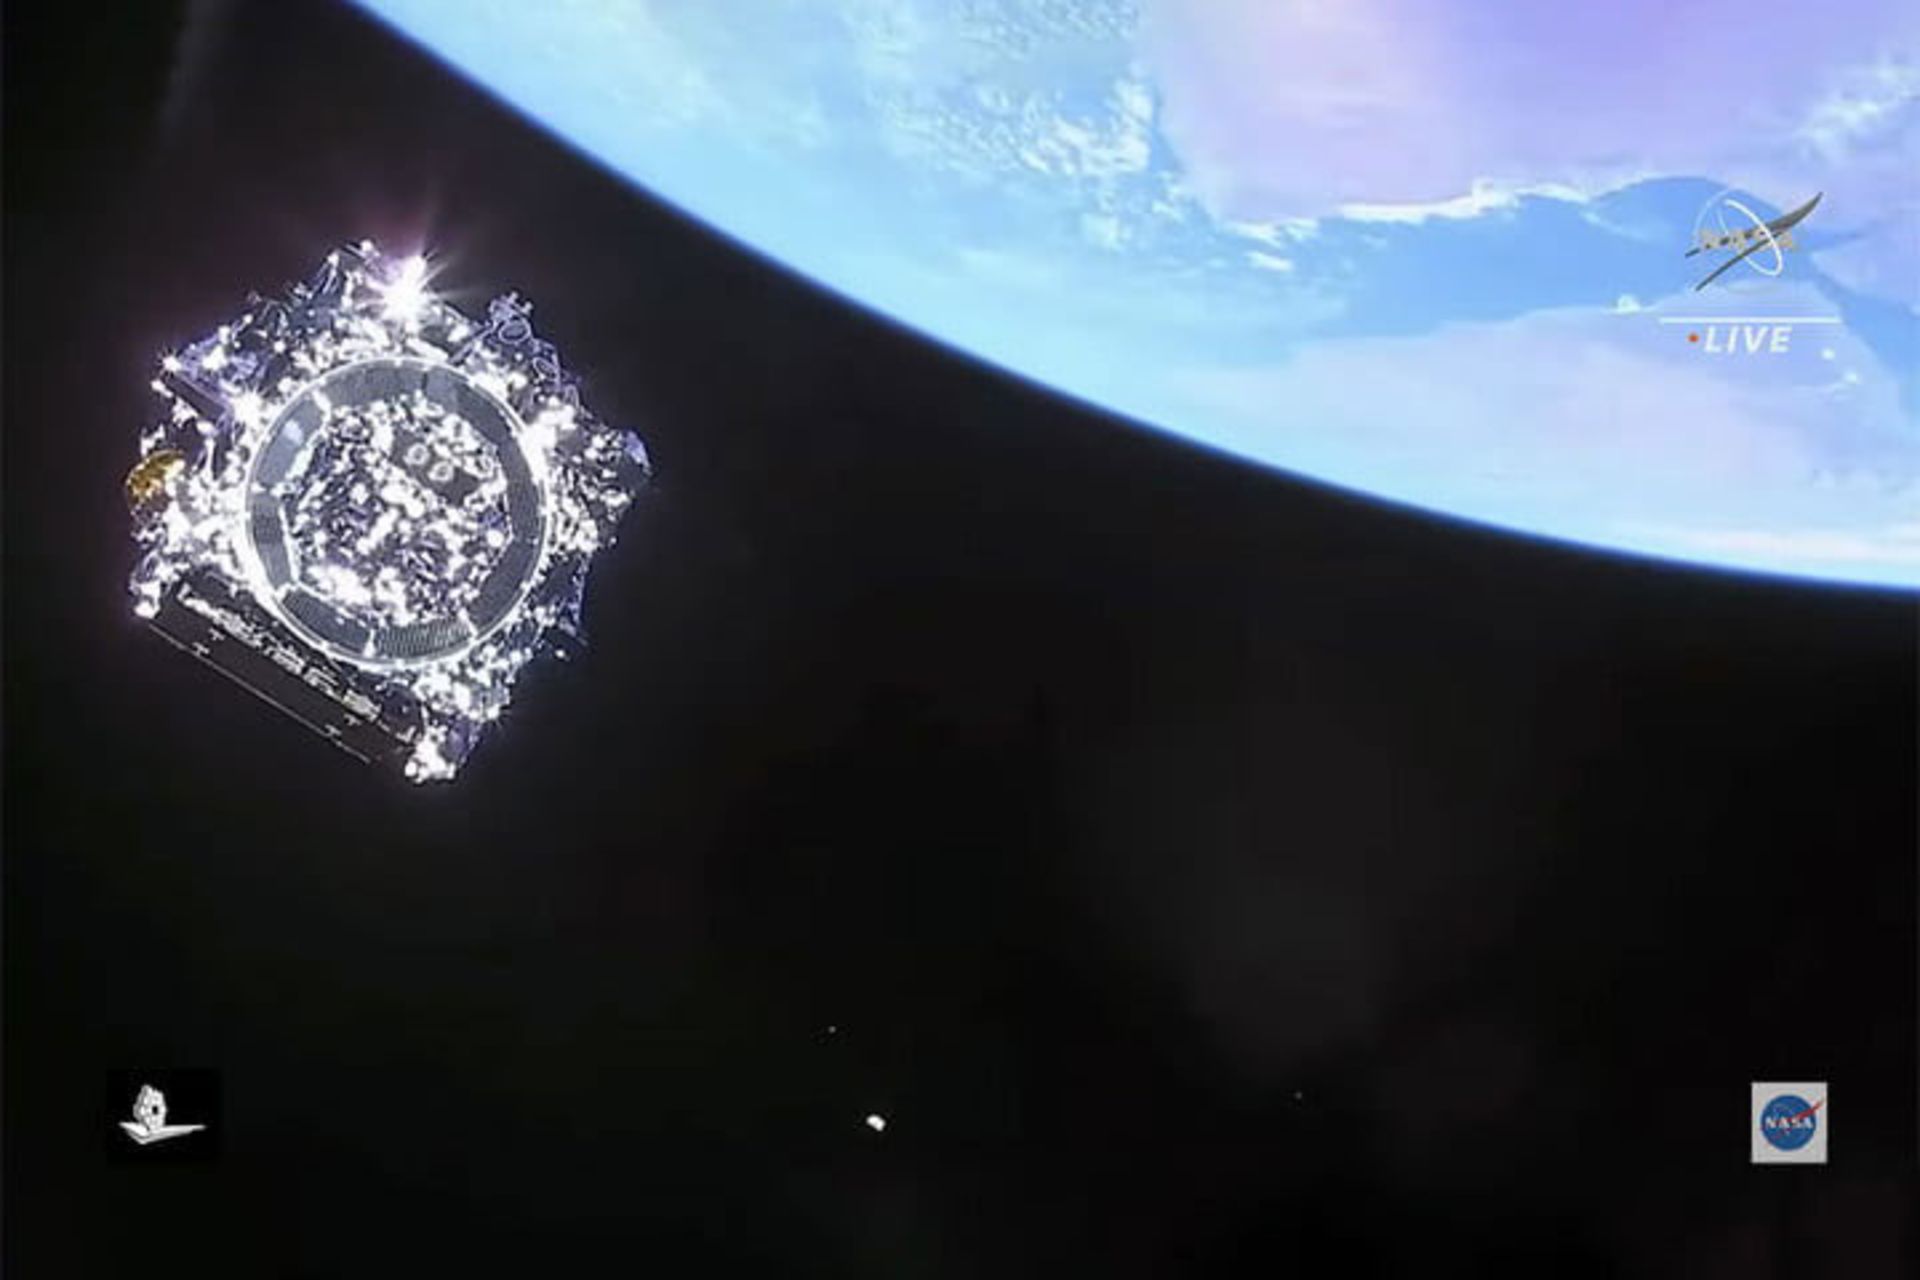
James Webb telescope after launch.
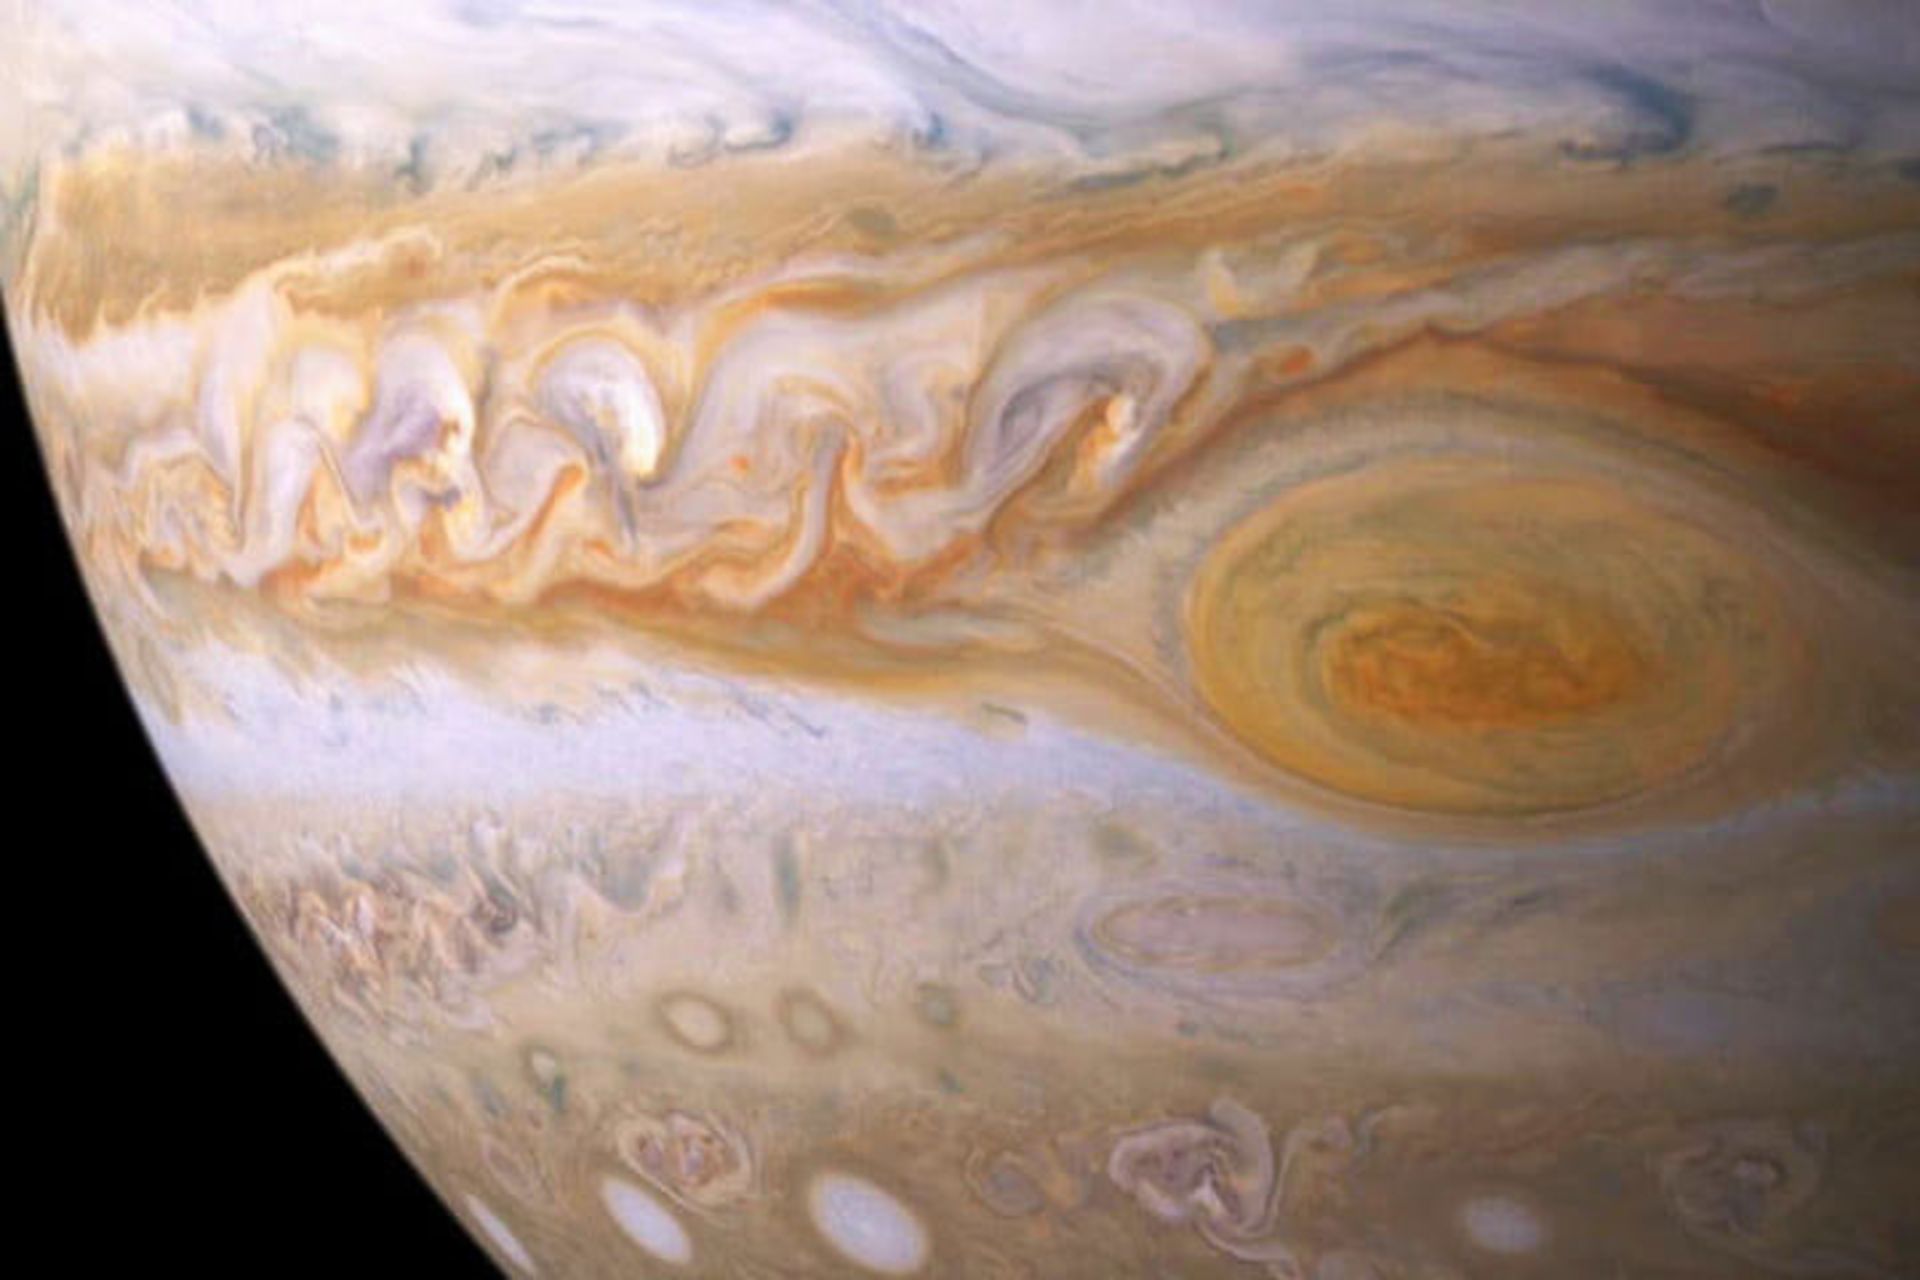
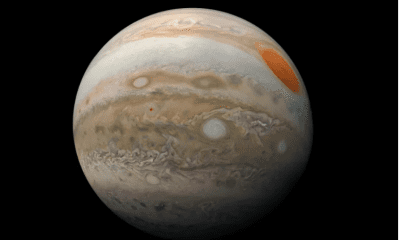
Some of the biggest questions about a client are related to its atmosphere. For example, how heat is transferred between different layers of the atmosphere and how the planet’s atmosphere interacts with its magnetosphere. Researchers observe details such as the Great Red Spot (a large, turbulent storm that appears as a large, Earth-sized dot) and the planet’s south pole (along with prominent auroras). They also investigate Jupiter’s lunar system, including the rings and moons Io and Ganymede.
Each of the mentioned goals is very attractive in turn. For example, Io is the most volcanic point in the Solar System, and Ganymede is the only moon known to produce its own magnetosphere. Overall, the Jupiter system is an ideal location to test the limits and capabilities of the James Webb Telescope.
Use of infrared
De Potter’s group is using the Webb Telescope’s infrared capabilities to help learn about complex topics, allowing researchers to look deeper into Jupiter’s atmosphere. These capabilities make it possible to study Jupiter’s atmosphere beyond the visible light spectrum. According to De Potter:
Clouds can be seen in the visible light spectrum; But in the infrared spectrum, it is possible to check the top of the clouds and below the clouds based on the wavelength. At different wavelengths, you can see different heights of the atmosphere based on the transparency of the atmosphere. For example, the amount of light absorbed in a certain wavelength shows how deep the planet can be penetrated.
Infrared wavelengths are particularly useful for research and can be observed with the Web’s Mid-Infrared Instrument or MIRI. According to De Potter:
Mid-infrared wavelengths are the most beneficial. We can observe some of these wavelengths from the ground, but the earth’s atmosphere is so turbulent that we cannot make good observations.
Ground-based infrared observations are associated with problems such as atmospheric obstacles; But with a space telescope like the James Webb, there are no obstacles and the background radiation is less; As a result, the collected data will be more accurate. In addition, the Web telescope has exceptional stability and thanks to precise positioning in space, it can point to a specific target without oscillation. All this means that this telescope can collect the most detailed data about Jupiter.
Testing the limits of the web
In evaluating proposals for the use of the James Webb Telescope, the committee will decide on the priority of the projects and the telescope’s application, Dipater said. According to Dipater, “They’re looking for projects to make the most of James Webb.”
Scientists use all four Webb telescope instruments in different combinations for different purposes in the Jupiter system to study features such as volcanoes, rings, and the planet’s atmosphere. The main plan of observing Jupiter was to study the rings and moons of Io and Ganymede; But a few years after the initial plan was approved, an unexpected problem occurred. The telescope’s sensitivity was too high for much of Jupiter’s planning. But researchers hoped to obtain valuable data; Therefore, they found solutions. They changed criteria such as usable filters and smaller viewing angles.
Why customer reviews are challenging
The issue of the telescope’s over-sensitivity may seem illogical, But it can be likened to taking a photo facing the sun. In this mode, all colors are lost and everything appears white, making it difficult to see details. The light received from the sun is very bright and creates an image with intense lighting.
The same problem occurs when studying astronomical objects. Planets do not emit much light compared to stars; Because they do not have their light, but reflect the light of their stars. Therefore, the planets are generally dimmer than the stars; But when looking at small details, or even looking for smaller objects like moons and rings, the planet’s light can interfere with data collection.
Similarly, this challenge arises to study Jupiter’s moons or rings with the James Webb telescope. Jupiter is one of the brightest objects in the night sky, so observing it is not an easy task. Fortunately, astronomers have a lot of experience in observing planetary rings with other instruments such as the Hubble Space Telescope. “We’re using previous experience with James Webb’s observations,” says de Potter. Researchers also observe the rings at different angles. With this, you can see how the light is scattered on the rings and then reduce this light so that the light of the rings itself remains.
Exploring the planets of the solar system and beyond
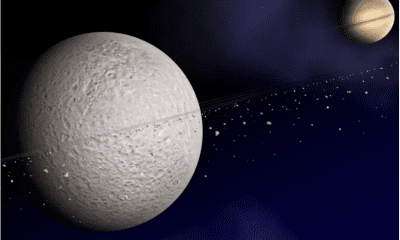
Using the web telescope for customer review is not the only way to test the capabilities of this new telescope; Because studying the planets in the solar system can help to understand the planets outside the solar system or extrasolar planets. One of the great scientific goals in the field of exoplanet knowledge is to move beyond simply identifying the planet and estimating its size or mass and reaching a more complete understanding of the planet’s atmospheric characteristics. Also, understanding the planets in distant systems helps to understand the planets of the solar system. The Webb telescope will study the atmospheres of distant gas giants, and then we can compare this data with what we know about the atmospheres of Saturn and Jupiter.
Additionally, by using the Webb Telescope to study Jupiter, the de Potter team is developing a suite of instruments that other members of the astronomy community can use to study other planets in the Solar System. They also provide a glimpse of the web’s capabilities, such as exploring more distant planets, including Uranus and Neptune. According to De Potter:
Our team is developing software that we can use not only for the Jupiter system but also for Uranus and Neptune. We can also show expectations based on observations. These findings will definitely be helpful.


How the James Webb Space Telescope deepens cosmology’s biggest controversy
Summary of the article:
- Almost a century ago, Edwin Hubble discovered the expansion of the universe and calculated the expansion rate or the cosmic constant.
- Since Hubble, many groups have tried to measure the expansion rate of the universe. However, the values they obtained differed from the theoretical predictions. This difference is called Hubble tension.
- Scientists today use three methods to measure the expansion rate of the universe: Cephasian variable stars, TRGB red giant stars, and JAGB asymptotic giants.
- However, the Hubble tension still exists, indicating that the methods for calculating the Hubble constant suffer from a systematic flaw.
- Researchers hope to be able to use the James Webb telescope in the coming years to achieve more accurate measurements of the universe’s expansion rate and thus resolve the Hubble tension.
Almost a century ago, Edwin Hubble discovered that the universe was getting bigger. However, today’s measurements of how fast the universe is expanding are contradictory. These discrepancies show that our understanding of the laws of physics may be incomplete. On the other hand, everyone expected the sharp eyes of the James Webb telescope to bring us closer to the answer to the riddle; But a new analysis of the telescope’s long-awaited observations once again reflects inconsistent expansion rates from different types of data, while pointing to possible sources of error.
Two competing groups have led efforts to measure the rate of expansion of the universe, known as Hubble’s constant, or H0. A group led by Adam Reiss of Johns Hopkins University, relying on the known constituents of the universe and the governing equations, has consistently calculated the Hubble constant to be approximately 8 percent higher than the theory predicts the universe’s expansion rate. This discrepancy, known as the Hubble tension, indicates that the model of the cosmological theory may have missed some elements such as raw materials or effects that speed up the expansion of the universe. Such an element can be a clue to a more complete understanding of the world.
This spring, Reiss and his team published new measurements of the Hubble constant based on data from the James Webb Telescope and found a value consistent with their previous estimates. However, a rival group led by Wendy Friedman of the University of Chicago warns that more precise measurements are needed. The team’s measurements of the Hubble constant are closer to the theoretical estimate than Riess’ calculations, suggesting that the Hubble stress may not be real.
Since the commissioning of the James Webb Telescope in 2022, the astrophysical community has been waiting for Friedman’s multidimensional analysis based on telescope observations of three types of stars. The results are now as follows: the two-star types provide estimates of the Hubble constant that are in line with the theoretical prediction; While the results of the third star, which is the same type used by Reiss, are consistent with his team’s higher estimates of Hubble’s constant. According to Friedman, the fact that the results of the three methods are contradictory does not mean that there are unknown physical foundations, but that there are some systematic errors in the calculation methods.
Contradictory world
The difficult part of measuring cosmic expansion is measuring the distance of space objects. In 1912, American astronomer Henrietta Levitt first used pulsating stars known as Cephasian variables to calculate distances. These stars flicker at a rate proportional to their intrinsic luminosity. By understanding the luminosity or radiant power of a Cephasian variable, we can compare it with its apparent brightness or dimming to estimate its galaxy’s distance from us.
Edwin Hubble used Levitt’s method to measure the distances to a set of galaxies hosting the Cephasian variable, and in 1929 he noticed that the galaxies that are farther away from us are moving away faster. This finding meant the expansion of the universe. Hubble calculated the expansion rate to be a constant value of 500 km/s per megaparsec. In other words, two galaxies that are 1 megaparsec or approximately 3.2 million light years apart are moving away from each other at a speed of 500 km/s.
As progress was made in calibrating the relationship between the pulsation frequency of Cepheids and their luminosity, measurements of the Hubble constant improved. However, since the Cephasian variables are very bright, the whole approach used has limitations. Scientists need a new way to measure the distance of galaxies from each other in the infinite space.
In the 1970s, researchers used Cephasian variables to measure the distance to bright supernovae, and in this way they achieved more accurate measurements of the Hubble constant. At that time, as now, two research groups undertook the measurements, and using supernovae and Cephasian variable stars, they achieved contradictory values of 50 km/s per megaparsec and 100 km/s per megaparsec. However, no agreement was reached and everything became completely bipolar.
 Edwin Hubble, the American astronomer who discovered the expansion of the universe, stands next to the Schmidt telescope at the Palomar Observatory in this photo from 1949.
The launch of the Hubble Space Telescope in 1990 gave astronomers a new and multi-layered view of the universe. Friedman led a multi-year observing campaign with Hubble, and in 2001 he and his colleagues estimated the expansion rate to be 72 km/s/Mpa with an uncertainty of at most 10%.
A Nobel laureate for the discovery of dark energy, Reiss got into the expansion game a few years later. In 2011, his group found the Hubble constant to be 73 with a three percent uncertainty. Soon after this, cosmologists excelled in another way. In 2013, they used Planck’s observations of light left over from the early universe to determine the exact shape and composition of the early universe.
In the next step, the researchers connected their findings to Einstein’s theory of general relativity and developed a theoretical model to predict the current state of the universe, up to approximately 14 billion years into the future. Based on these calculations, the universe should be expanding at an approximate rate of 67.4 km/s per megaparsec with an uncertainty of less than one percent.
Reese’s team measurement remained at 73, even with the improved accuracy. This higher value indicates that the galaxies today are moving away from each other at a faster rate than theoretically expected. This is how the Hubble tension was born. According to Reiss, today’s Hubble tension shows us that something is missing in the cosmological model.
The missing factor could be the first new element in the universe to be discovered since dark energy. Theorists still have doubts about the identity of this agent. Perhaps this force is some kind of repulsive energy that lasted for a short time in the early universe, or perhaps it is the primordial magnetic fields created during the Big Bang, or perhaps what is being missed is more about ourselves than the universe.
Ways of seeing
Some cosmologists, including Friedman, suspected that unknown errors were to blame for Hubble’s tension. For example, Cephasian variable stars are located in the disks of younger galaxies in regions full of stars, dust, and gas. Even with Hubble’s fine resolution, you don’t see a single Cephasian variable, according to George Afstatio, an astrophysicist at the University of Cambridge. Rather, you see it overlapping with other stars. This density of stars makes measurements of brightness difficult.
When the James Webb Telescope launches in 2021, Reiss and his colleagues will use its powerful infrared camera to peer into the crowded regions that host the Cephasian variables. They wanted to know whether the claims of Friedman and other researchers about the effect of the area’s crowding on the observations were correct.
 The 6.5-meter multi-section mirror of the James Webb Space Telescope at NASA’s Goddard Space Flight Center in Maryland. This mirror passed various test stages in 2017.
When the researchers compared the new numbers to distances calculated from Hubble data, they saw a surprising match. The latest results from the James Webb telescope confirmed the Hubble constant measured by the Hubble telescope a few years ago: 73 km/s/Mpa with a difference of one kilometer or so.
Concerned about crowding, Friedman turned to alternative stars that could serve as distance indicators. These stars are found in the outer reaches of galaxies and away from the crowd. One of those stars belongs to the group ” Red Giant Branch ” or TRGB for short. A red giant is an old star with a puffy atmosphere that shines brightly in the red light spectrum. As a red giant ages, it eventually burns helium in its core, and at this point, the star’s temperature and brightness suddenly decrease.
A typical galaxy has many red giants. If you plot the brightness of these stars against their temperature, you reach a point where the brightness drops off. The star population before this brightness drop is a good distance indicator; Because in each galaxy, such a population has a similar distribution of luminosity. By comparing the brightness of these star populations, astronomers can estimate their relative distances.
The Hubble tension shows that the standard model of the cosmos is missing something
Regardless of the method used, physicists must calculate the absolute distance of at least one galaxy as a reference point in order to calibrate the entire scale. Using TRGB as a distance index is more complicated than using Kyphousian variables. MacKinnon and colleagues used nine wavelength filters from the James Webb telescope to understand how brightness relates to their color.
Astronomers are also looking for a new indicator: carbon-rich stars that belong to a group known as the “Jay region asymptotic giant” (JAGB). These stars are far from the bright disk of the galaxy and emit a lot of infrared light. However, it was not possible to observe them at long distances until James Webb’s launch.
Friedman and his team have applied for observation time with the James Webb Space Telescope in order to observe TRGBs and JAGBs, along with more fixed spacing indices and Cephasian variables, in 11 galaxies.
The vanishing solution
On March 13, 2024, Friedman, Lee, and the rest of the team meet in Chicago to find out what they’ve been hiding from each other. Over the past months, they were divided into three groups, each tasked with measuring distances to 11 galaxies using one of three methods: Cephasian variable stars, TRGBs, and JAGBs.
These galaxies also host related types of supernovae, so their distances can calibrate the distances of supernovae in many more distant galaxies. The rate at which galaxies move away from us divided by their distance gives the value of the Hubble constant.
 Wendy Friedman at the University of Chicago is trying to fit the James Webb Telescope observations into the Standard Cosmological Model.
Three groups of researchers calculated distance measures with a unique, random counterbalancing value added to the data. During the face-to-face session, they removed those values and compared the results.
All three methods obtained similar distances with three percent uncertainty. Finally, the group calculated three values of Hubble’s constant for each distance index. All values were within the theoretical prediction range of 67.4. Therefore, Hubble’s tension seemed to be resolved. However, they ran into problems with further analysis to write the results.
The JAGB analysis was good, But the other two were wrong. The team found that there were large error bars in the TRGB measurements. They tried to minimize the errors by including more TRGBs; But when they started doing this, they found that the distance to the galaxies was less than they first thought. This change caused the value of Hubble’s constant to increase.
Friedman’s team also discovered an error in Cephaus’s analysis: in almost half of the pulsating stars, the term crowd was applied twice. Correcting this error increased the value of Hubble’s constant significantly. Hubble’s tension was revived.
Finally, after efforts to fix the errors, the researchers’ paper presents three distinct values of Hubble’s constant. The JAGB measurement yielded a result of 67.96 km/s/megaparsec. The TRGB result was equal to 69.85 with similar error margins. Hubble’s constant was obtained at a higher value of 72.05 in the Kyphousian variable method. In this way, different hypotheses about the characteristics of these stars caused Hubble’s stress value to vary from 69 to 73.
By combining the aforementioned methods and uncertainties, the average Hubble stress value equal to 69.96 was obtained with an uncertainty of four percent. This margin of error overlaps with the theoretical prediction of the expansion rate of the universe, as well as the higher value of Tim Reiss.
Tensions and resolutions
The James Webb Space Telescope has provided methods for measuring the Hubble constant. The idea is simple: closer galaxies look more massive; Because you can make out some of their stars, while more distant galaxies have a more uniform appearance.
A method called gravitational convergence is more promising. A massive galaxy cluster acts like a magnifying glass, bending and magnifying the image of a background object, creating multiple images of the background object when its light takes different paths.
Brenda Fry, an astronomer at the University of Arizona, is leading a program to observe seven clusters with the James Webb Space Telescope. Looking at the first images they captured last year of the G165 cluster, Fry and his colleagues noticed three spots that were not previously seen in the images. These three points were actually separate images of a supernova that was located in the background of the aforementioned cluster.
After repeating the observation several times, the researchers calculated the difference between the arrival times of the three gravitational lensing images of the supernova. This time delay is proportional to Hubble’s constant and can be used to calculate this value. The group obtained an expansion velocity of 75.4 km/s/Mpa with a large uncertainty of 8.1%. Fry expects the error bars to correct after several years of similar measurements.
Both Friedman’s and Reiss’ teams predict that they will be able to get a better answer with James Webb’s observations in the coming years. “With improved data, the Hubble tension will eventually be resolved, and I think we’ll get to the bottom of it very quickly,” Friedman says.
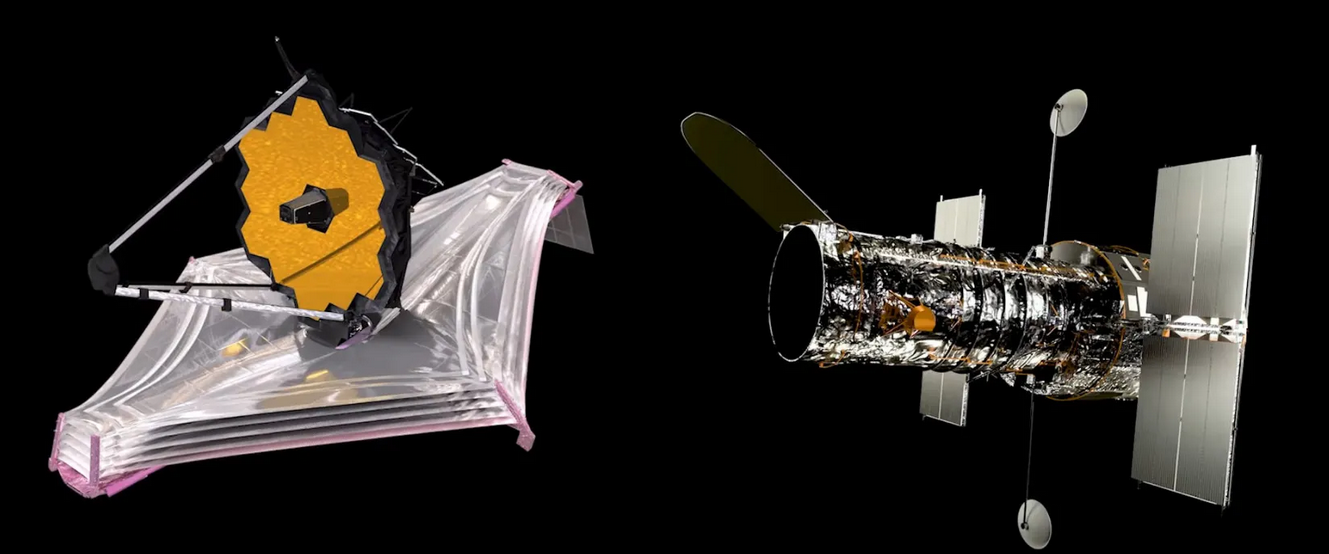
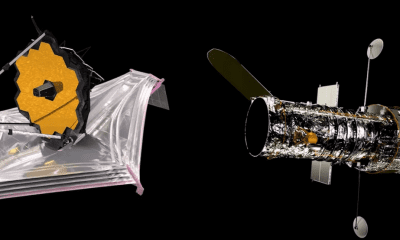
James Webb vs. Hubble; Comparing the images of two space telescopes
The James Webb Space Telescope is now the flagship of the world of space telescopes. James Webb uses the largest mirror of any telescope launched into space and orbits the Sun at a distance from Earth (approximately 1.5 million kilometers). This telescope is supposed to make a big change in astronomy and astrophysics by looking at the farthest parts of the world and unveiling new secrets.
However, in the past three decades, the Hubble Space Telescope has been the main player in the field of space telescopes. Launched in 1990, this telescope has recorded many epic images of planets, stars, galaxies, nebulae and many other astronomical wonders.
Since Hubble was in near-Earth orbit, it could take accurate pictures of the universe without the Earth’s atmosphere interfering with its operation. The telescope captured amazing images during its prolific career and continues to serve its mission. According to NASA, over the past 32 years, Hubble has made 1.5 million observations and contributed to more than 19,000 scientific papers.
Now James Webb is going to take the flag from Hubble and further enhance our understanding of the universe. In a blog post comparing the two space telescopes, NASA called James Webb the “scientific successor” to Hubble. Without Hubble’s observations of the cosmos, researchers would not have prioritized building a telescope that could go beyond Hubble’s field of view. Continue with Zoomit to have a closer look at the images of celestial targets in both telescopes.
Deep field
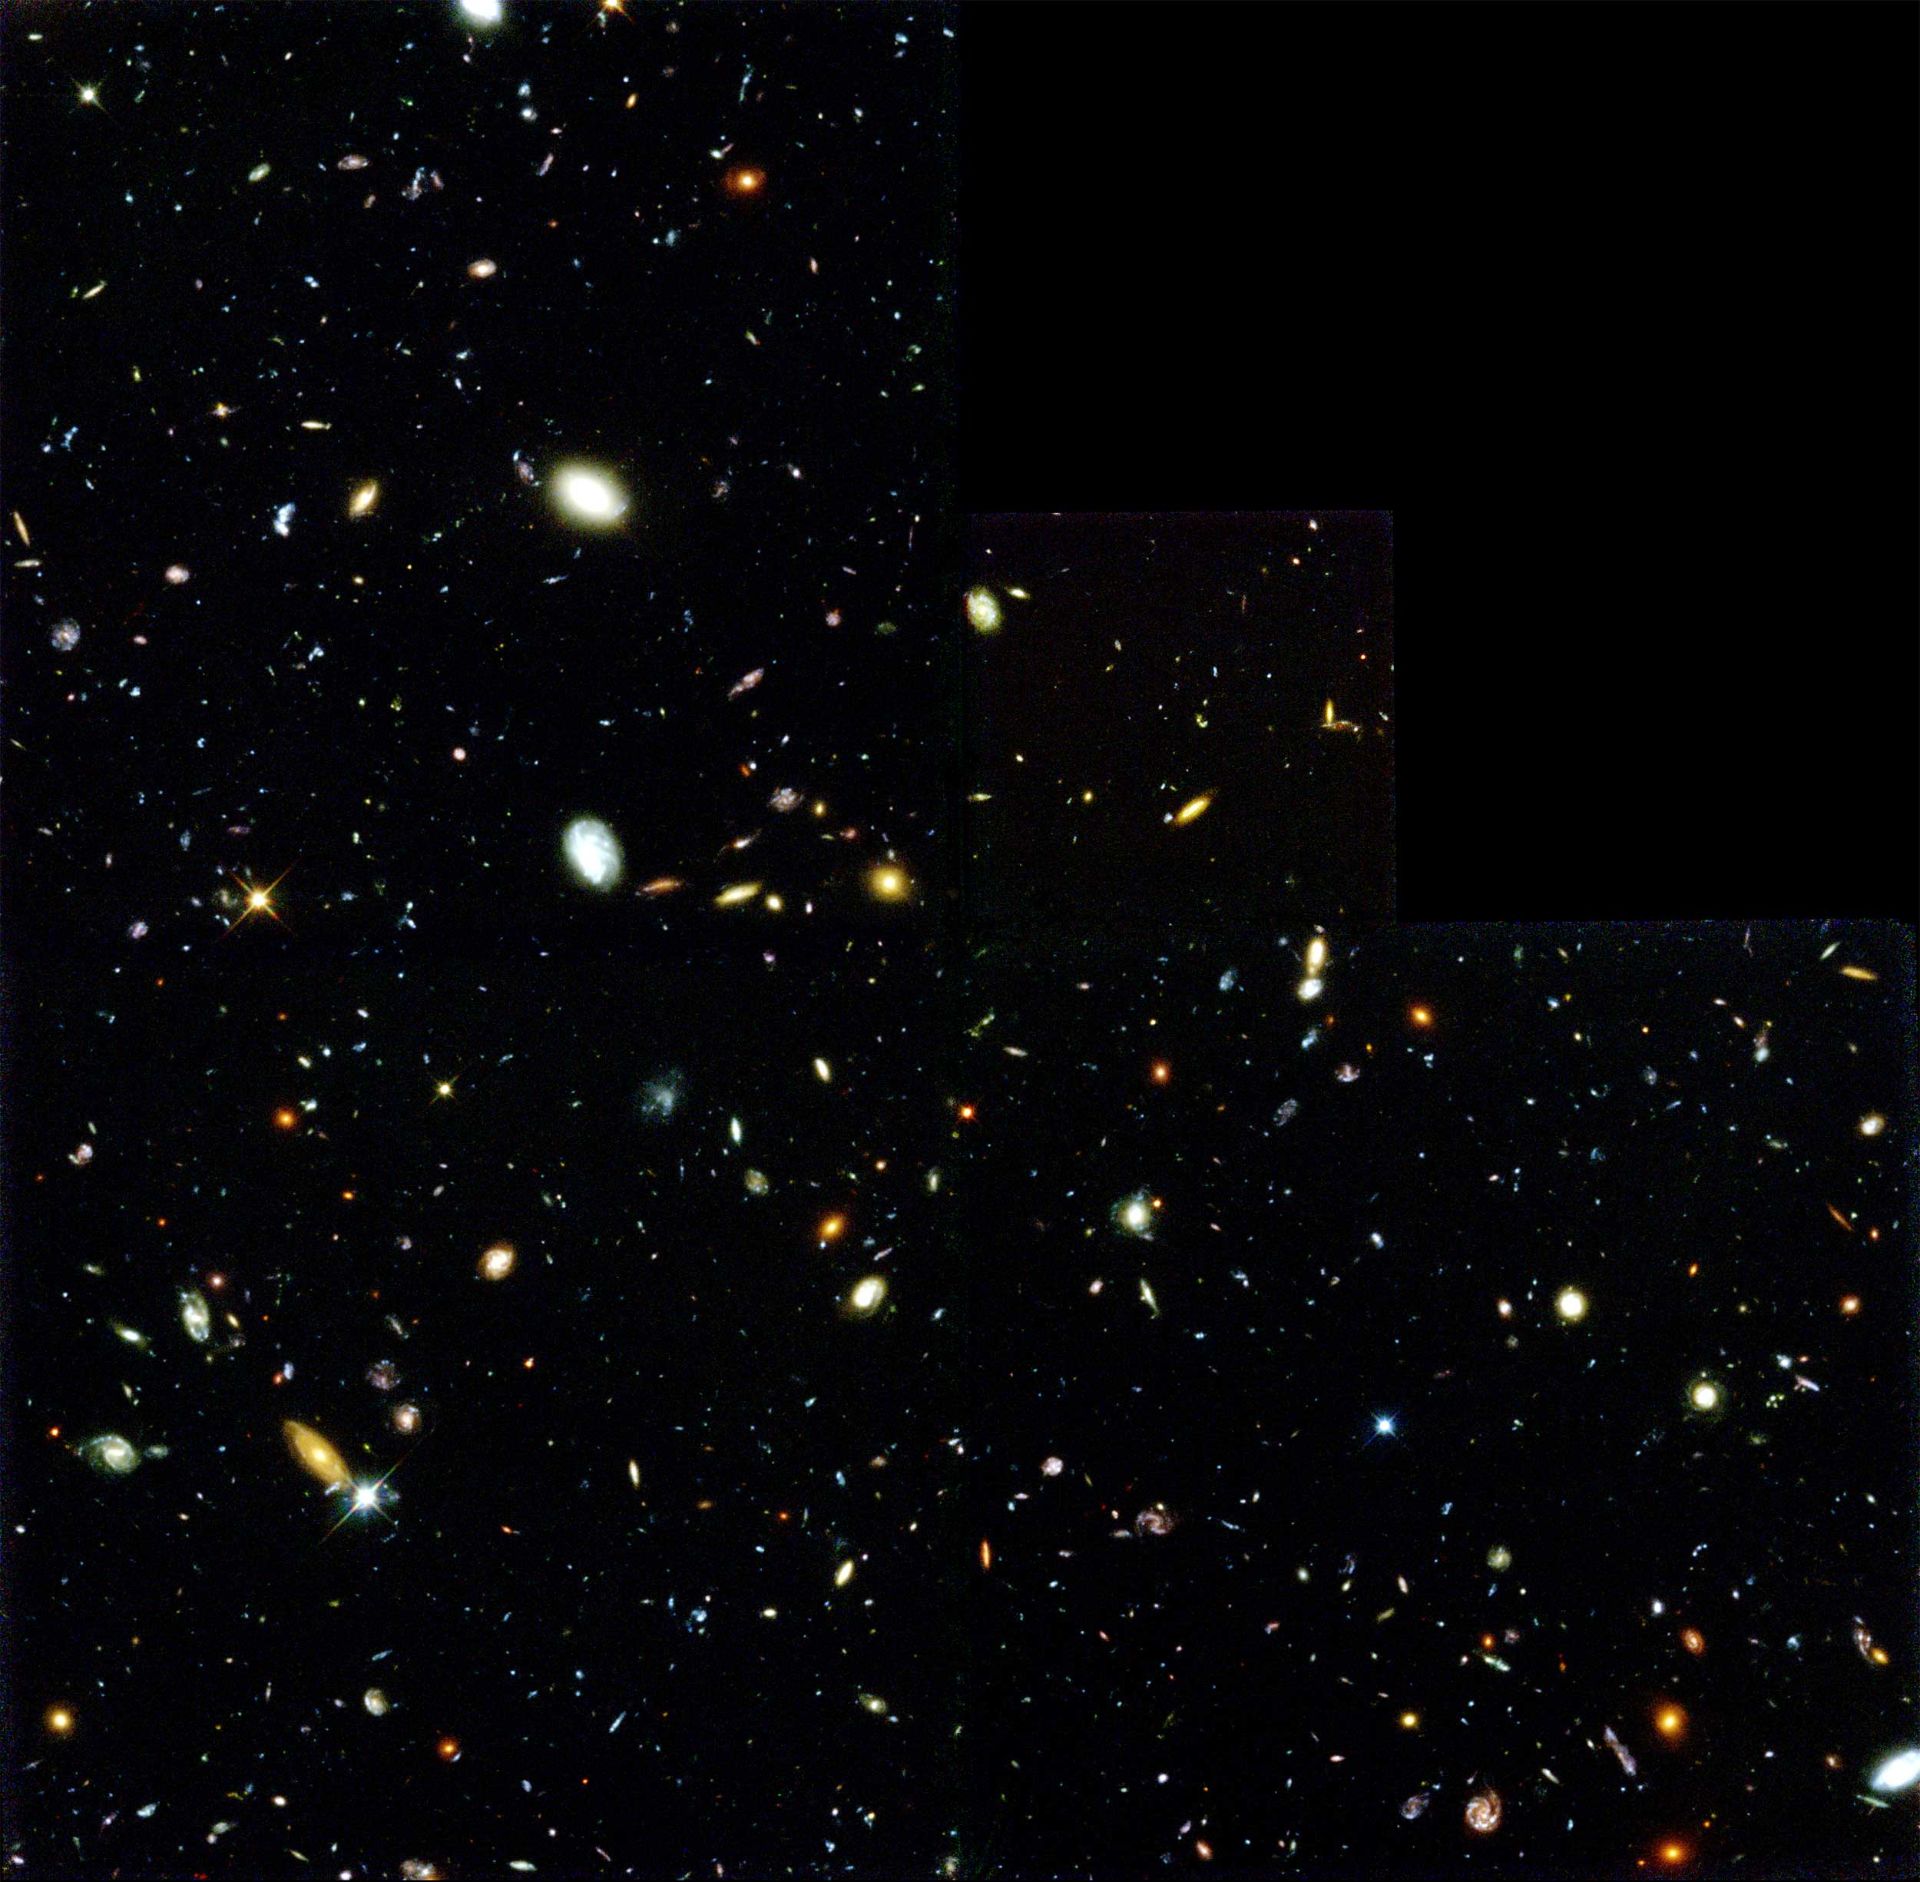
The top right photo is the deep Hubble wallpaper taken in 1995 and released in 1996. At the time of recording, this photo was considered the deepest image taken of the universe. In order to make it, the researchers took 342 photos during 10 days with a total of 100 hours of exposure. The final result revealed more than three thousand scattered galaxies in a very small part of the sky. Over the next few decades, Hubble operators took better pictures of this type and looked much deeper into space.
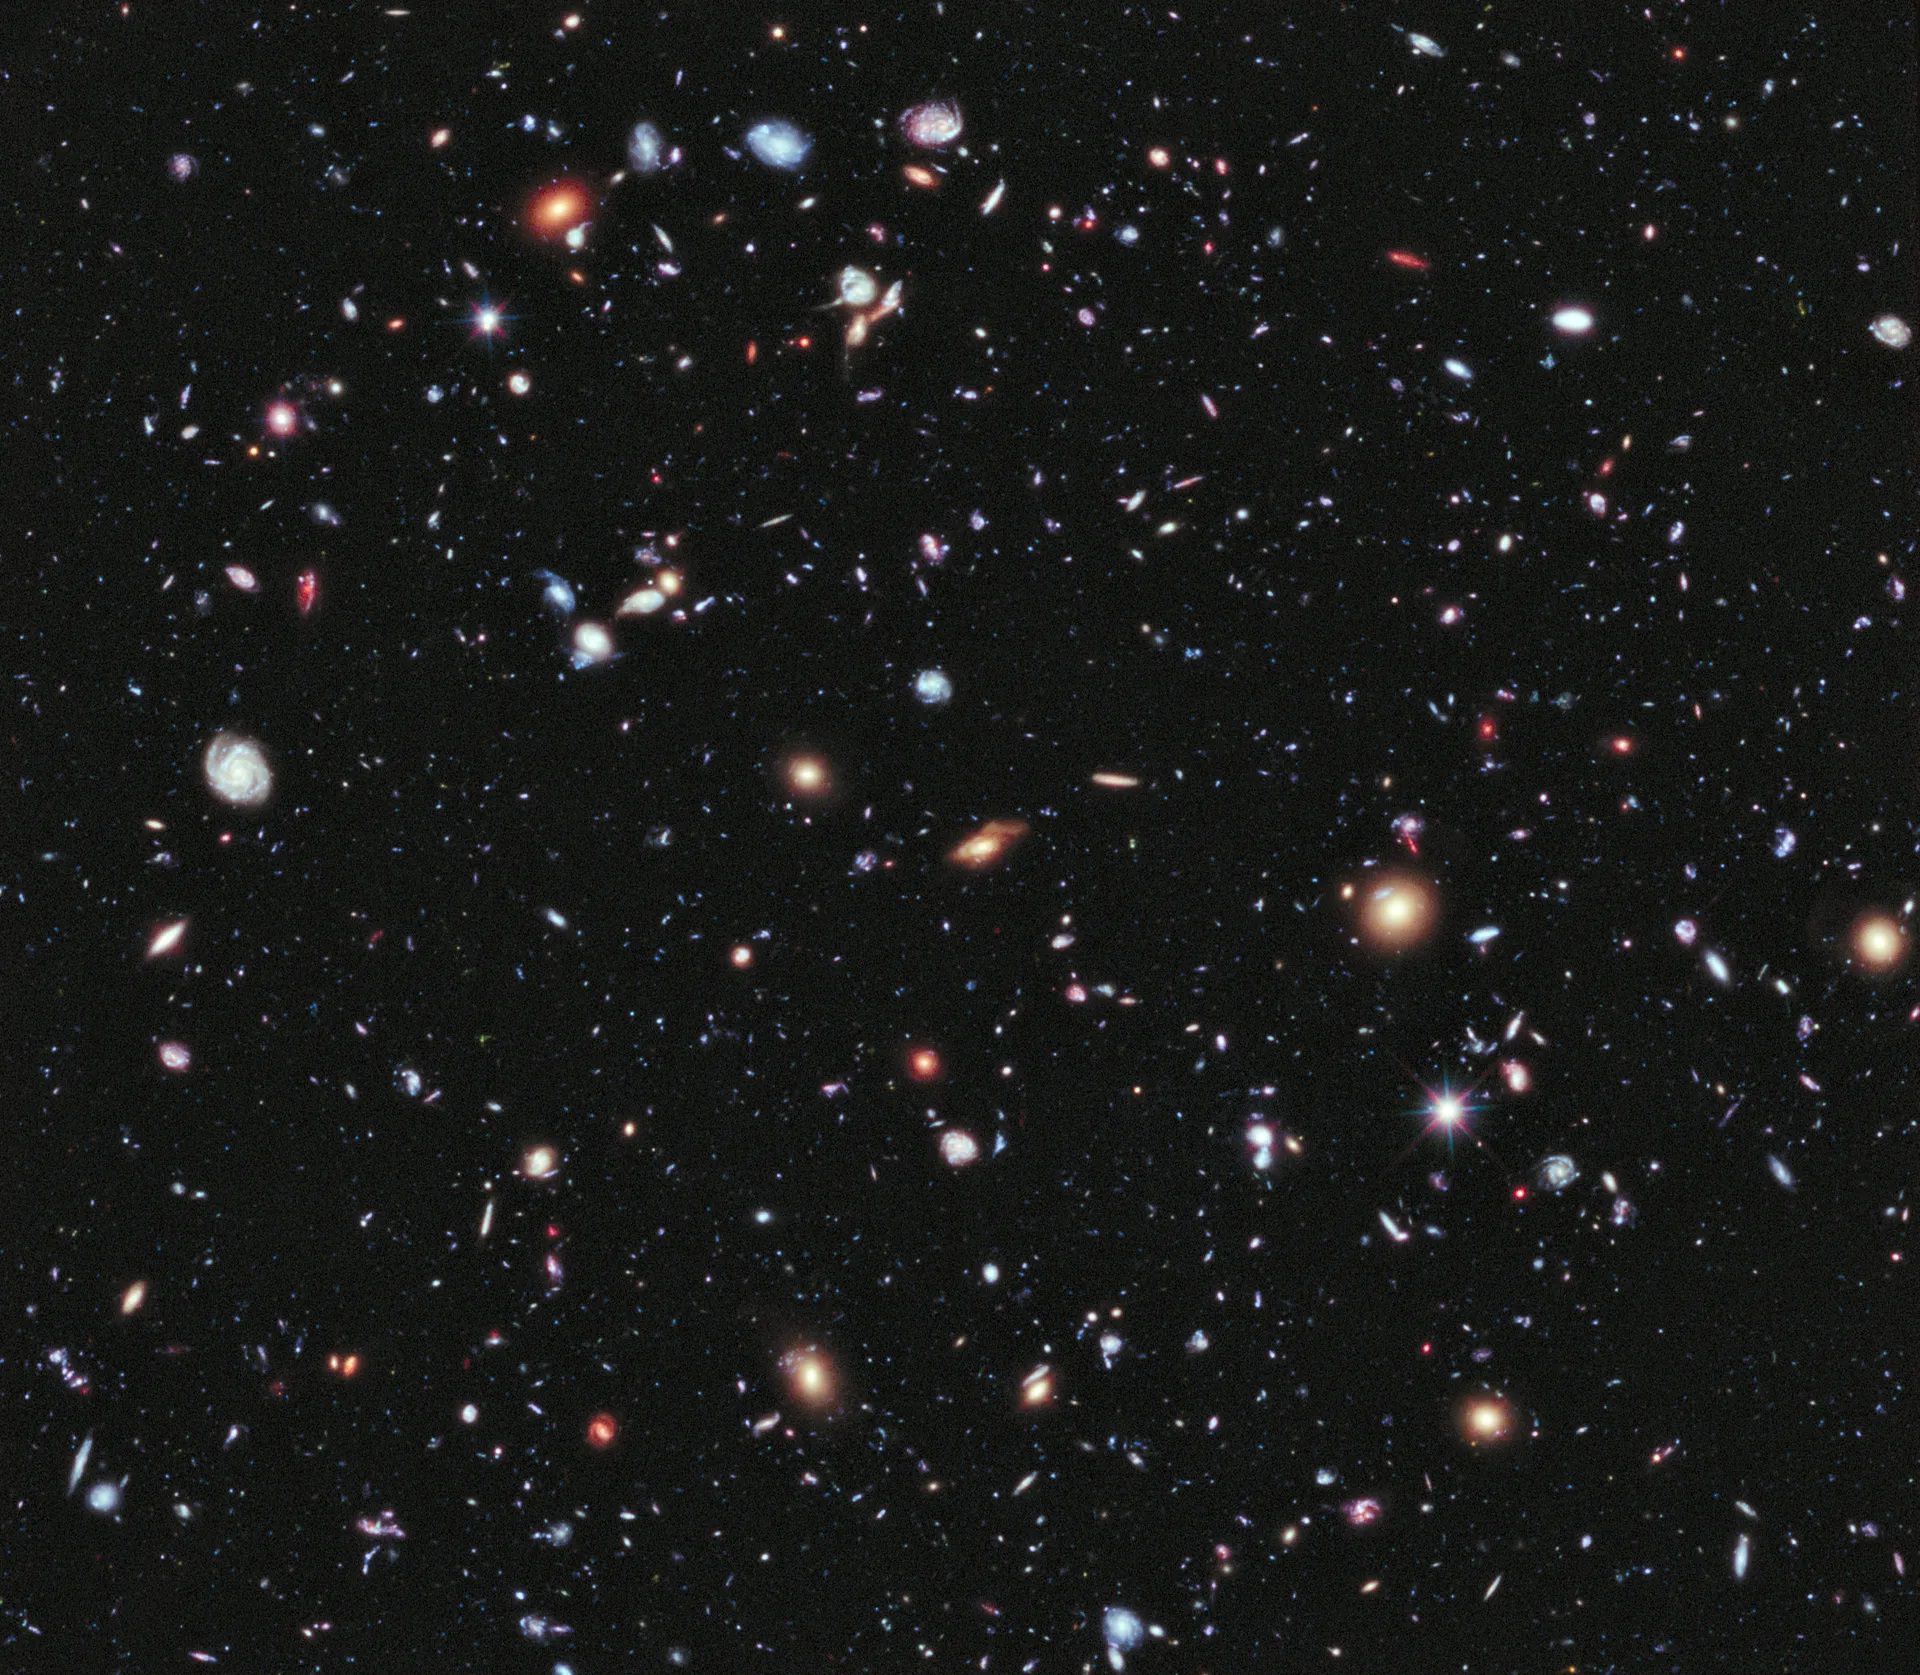
The Hubble Ultra Deep Image or XDF was released in 2012.
The photo above is the Hubble Ultra Deep Wallpaper released in 2012. More than 5500 galaxies are visible in this photo. Over the course of a decade, the researchers collected 50 days of observations from a concentrated area, resulting in two million seconds of exposure (over 23 days).
Then along came James Webb. The first full-color scientific photo by James Webb was released on Tuesday morning Iran time by US President Joe Biden as a preview for the first set of telescope images. While capturing Hubble’s deep fields required days, if not weeks, of exposure, James Webb managed to capture this image after just 12.5 hours of exposure.
The recorded area of the sky in the image above is incredibly small; So small that it is about the size of a grain of sand on a person’s hand on the ground. In that part of the sky, a galaxy cluster called SMACS 0732 is located 4.6 billion light-years away. This cluster is so large that it bends space-time around it and, like a cosmic microscope, reveals faint galaxies far behind it. Some of these galaxies are considered to be the faintest infrared objects ever observed, and scientists are eagerly waiting to learn more about them.
Shahabhi Nebula (Karina)
The image above shows one of Hubble’s most popular targets, the Carina Nebula, at a distance of 7,200 light years from us. The image on the right, released by the Hubble Heritage Project in 2008, shows part of the star-forming region in the corner of the nebula.
The picture looks like an impressionist landscape with hills, valleys, and columns of gas and dust scattered around, with only a few bright stars behind the nebula. Now James Webb’s updated image shows the same stunning landscape in much greater detail and clarity. In the photo, there are stars that were previously hidden behind gas and dust.
Read more: Why is Jupiter one of the first targets of the James Webb Space Telescope?
Stephan’s quintuplets
This group of five galaxies is stunning in a Hubble image taken in 2009 after the telescope’s camera was upgraded earlier that year. That year, the space shuttle made its fifth and final visit to Hubble and applied a major upgrade. In addition to the new camera that took this photo, the telescope was also upgraded and repaired. The ability of astronauts to rendezvous with Hubble in near-Earth orbit kept the space telescope operational for a very long time.
However since James Webb is so far from Earth, he will not have the advantage of meeting astronauts. However, the spacecraft has enough fuel for at least 20 years; This means that in the future we will see many more images like the one above.
The photo above shows a group of galaxies that were first observed in 1877. The upper left galaxy is considered the alien mass of the group and is much closer to Earth than the other four members. However, the other four galaxies are so close that James Webb can see the shock waves from the interaction between them as they kill each other.
Stephen’s quintuplet is the largest image taken by the James Webb Telescope and is actually a mosaic made up of more than a thousand separate images captured by the telescope’s two instruments: the Near Infrared Camera (NIRCam) and the Mid-Infrared Instrument (MIRI). Both cameras collect infrared wavelengths of light and help James Webb see through gas and dust; But as their names suggest, both collect different wavelengths of infrared light.
Southern Ring Nebula
The last image is the Southern Ring Nebula, which was imaged by Hubble in 1998. The “ring” is the dying star particles (the faintest of the two bright spots in the center of the image). The little white dwarf causing all this chaos was a star the size of our Sun. At some point, the star ran out of fuel and ejected its outer layers, creating the ring seen in the image. The diameter of the ring is about half a light year and the gases are moving outward at a speed of nearly 14.5 km/s.
On the left, the Southern Ring Nebula is seen through the eyes of James Webb’s two instruments, Nirkem and Miri. The image we have chosen for comparison was captured by Nirkam’s near-infrared camera. Another version of the image is also recorded in mid-infrared.
There is more than one way for planets to be born
When it comes to planet formation, astronomers refer to the “bottom-up” definition of Cassandra Hall, an astronomer at the Center for Simulation Physics at the University of Georgia: The swirling gas and dust around a young star slowly accumulates over millions of years, and gravity pulls this material into It turns into a spherical mass.
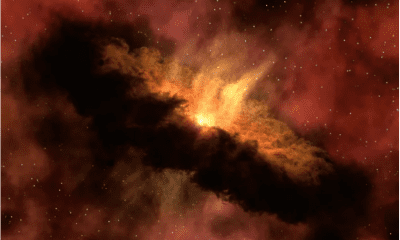
However, based on the findings of Dr. Hall and his colleagues, published this month in the journal Nature, the above scenario could be more complicated. In a star system 508 light-years from Earth, researchers have found conditions that support an alternative “top-down” approach to planet formation. There, fertile material orbiting a young star rapidly collapses to form a planet. This mechanism, called gravitational instability, could explain the existence of mysterious massive worlds in the strange orbits of relatively young stars.
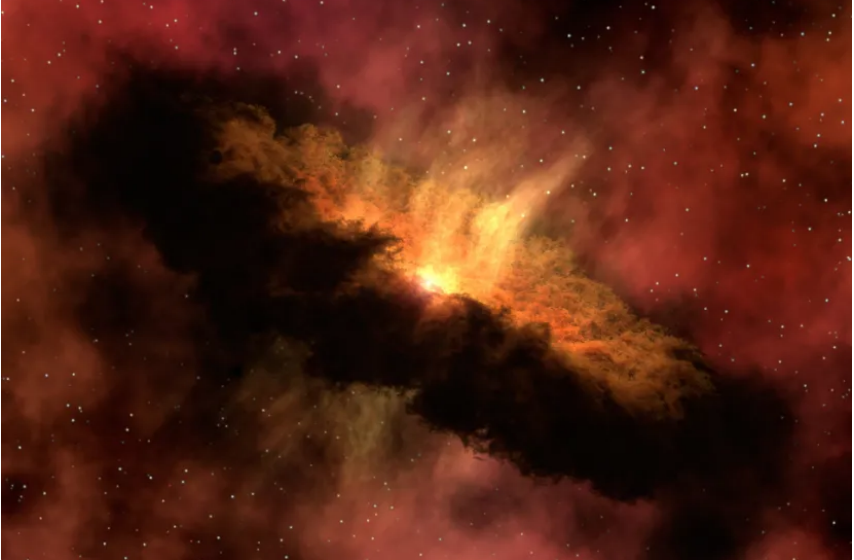
Cosmic matter orbiting baby stars has a high potential for planet formation. This material is called a protoplanetary disk, its rotation is influenced by the gravity of the host star; But if the disk grows large enough, it can become overwhelmed by its own gravity, destabilizing the young star system. The dense parts of the disk form spiral arms similar to the swirling clouds in a tornado. According to Jesse Speedy, a graduate student at the University of Victoria in Canada, such a star resembles the eye of a storm.
The video below shows simulations of objects that have between five and 15 times the mass of Jupiter and formed through gravitational instability in a very young disk.
According to Speedy, if the arms of the young disk absorb enough material, they can form clumps that later collapse and become gas giant planets. Unlike a bottom-up method like nuclear accretion, which takes millions of years, this happens in just a few hundred years. Speedy continues:
These two theories competed with each other in astronomy for a while; But for the first time, we were able to reach definitive evidence that a gravitational instability pathway is possible.
Gravitationally unstable disks can be the birthplace of massive planets, far from their host stars, and thus the core accretion method is not very suitable for these planets. In 2022, astronomers published a report of the discovery of a protoplanet with nine times the mass of the planet Jupiter around the star EB Chariot, which is not more than four million years old. The object was located at a distance of 13.8 billion kilometers from its star, which is twice the distance between our Sun and Pluto.
 The star Ebay Arabahran is almost four million years old. The star is surrounded by swirling waves of accreting gas, within which protoplanets form. This image was captured by the Atacama Massive Millimeter/Submillimeter Array located in Chile.
Similar planets have been discovered elsewhere. It is almost impossible to describe how these planets formed through the “bottom-up” process; Because there is not enough solid material to form these objects through the core accretion pattern.
In the 1980s, astronomers proposed a hypothesis based on which gravitational instability could create these unusual planets; But they did not find a way to prove this. According to a 2020 simulation by Dr. Hall and colleagues, the initial velocity of the material in the gravitationally unstable disk changes in a distinct pattern.
A few years later, Dr. Hall’s group pointed the Atacama Massive Submillimeter/Millimeter Array, the Large Chile Radio Telescope, at the star EB Chariot and obtained the exact effect predicted in the simulations.
Even if the results are correct, they only prove that gravitational instability occurs and its role in planet formation remains to be proven. Probably, this mechanism helps the formation of planets along with the growth of the core. Indeed, we expect all planet-forming environments to undergo a phase of gravitational instability during which planets may form through gravitational collapse and core accretion.
Astronomers in the current study want to look for signs of gravitational instability in younger star systems in the future. They hope to eventually find signs of a gravitational instability mechanism in fully formed worlds.
Speedy also seeks to learn more about the diversity of planets, the different forms of formation, and what is revealed about the solar system. “I believe the world is much more creative than we think,” he says. Therefore, we are interested in exploring the possibilities.

Starlink; Everything you need to know about SpaceX Satellite Internet

iOS 18 review: A smart update even without Apple’s intelligence

James Webb Space Telescope deepens cosmology’s biggest controversy

James Webb vs. Hubble

Everything you need to know about the Windows Blue Screen of Death

How to use iMessage on Android?

Xiaomi Glorimi M2 Max watch review; Alternative economic option for iPhone owners

Ten strange moons of the solar system

Can coffee consumption cause weight loss?

Designed in California, copied in the Soviet Union; The story of the first Soviet chip
-
 Technology1 year ago
Who has checked our Whatsapp profile viewed my Whatsapp August 2023
-
Technology1 year ago
Second WhatsApp , how to install and download dual WhatsApp August 2023
-
Technology1 year ago
How to use ChatGPT on Android and iOS
-
AI2 years ago
Uber replaces human drivers with robots
-
Technology1 year ago
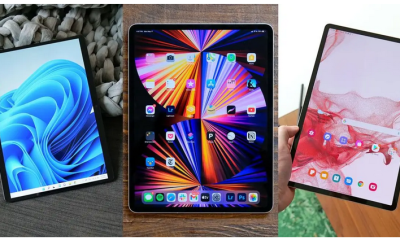
The best Android tablets 2023, buying guide
-
Technology1 year ago
The best photography cameras 2023, buying guide and price
-
Humans2 years ago
Cell Rover analyzes the inside of cells without destroying them
-
Technology1 year ago
How to prevent automatic download of applications on Samsung phones